Geoscience Reference
In-Depth Information
N
g
C
J
r
r
C
D S
O
Œ
PHANEROZOIC
Major perturbations of
ocean chemistry
(B)
8.4
modern (pre-industrial) pH
8.2
8.0
7.8
7.6
7.4
7.2
(C)
50
40
30
20
10
0
modern ocean
(D)
Major changes in plankton assemblage
Acritarchs
Dinoflagellates
Diatoms
Coccolithophorids
Globigerinina
Radiolaria
(E)
0
20
40
60
80
Latitudinal extent of glaciation
(F)
6000
5000
4000
3000
2000
1000
0
0
100
200
Time (millions of years before present)
300
400
500
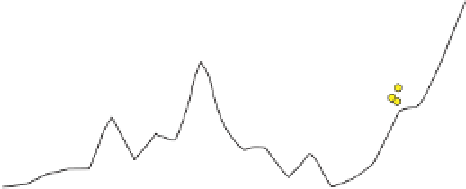
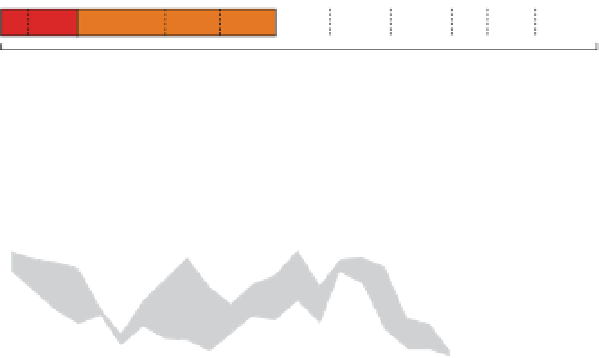
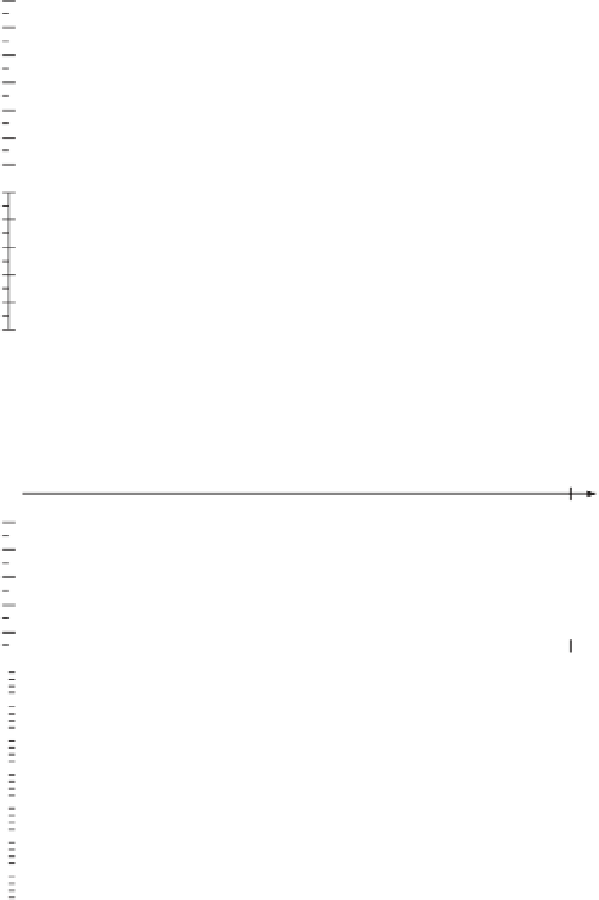
Figure 2.4
The geological context for past changes in ocean carbonate chemistry (modii ed after Kump et al. 2009). (A) Major global carbon cycle events
during the past ~500 Myr. (B) Evolution of ocean surface pH
sws
( Tyrrell and Zeebe 2004 ; Ridgwell 2005 ; Ridgwell and Zeebe 2005 , Ridgwell and Schmidt
2010). Black line: response of the global carbonate cycle to the mean palaeo-
p
CO
2
reconstruction; grey-i lled envelope: response to the uncertainty (one
standard deviation) in palaeo-
p
CO
2
; orange-i lled circle: estimates for the late Palaeocene. (C) Reconstructed Ca
2+
concentrations (Lowenstein et al. 2001 ).
(D) Major changes in plankton assemblages (Martin 1995). Calcifying taxa are highlighted in yellow with non-calcifying taxa shown in grey and blue. The
rise during the early- to mid-Mesozoic of the importance of Globigerinina is shown as broadly representative of the timing of changes of planktic
foraminiferal taxa in general, although the evolution of the i rst foraminifera taxon occurred somewhat earlier in the mid-Paleozoic ( Martin 1995 ). (E)
Latitudinal extent of glaciation (Crowley and Burke 1998). (F) Phanerozoic evolution of atmospheric p CO
2
reconstructed from proxy records (yellow-i lled
circles) by Royer et al. ( 2004 ). Palaeo- p CO
2
data have been binned into 20 Myr intervals, with the mean indicated by green squares and one standard
deviation indicated by error bars. The geological timescale is delineated at the top.