Geoscience Reference
In-Depth Information
toward the present (Monnin
et al.
2004 ). Ocean
chemistry was also quite stable during the same
interval. This has been indicated by deep-sea car-
bonate ion proxy records, although slightly larger
changes than those expected to accompany the 20
ppmv rise in atmospheric CO
2
cannot be excluded
( Broecker and Clark 2007 ).
Overall, the data suggest that the Holocene car-
bon cycle was in or close to steady-state conditions
with generally minor imbalances in carbon sources
and sinks, some of which were in response to the
recovery from the last deglaciation (Elsig
et al.
2009). Using the Holocene atmospheric CO
2
record,
we have hindcast changes in ocean carbonate
chemistry using the carbon cycle model LOSCAR
(Long-term Ocean-atmosphere-Sediment CArbon
cycle Reservoir model; Zeebe
et al.
2008 , 2009 ). Our
results indicate that Holocene ocean carbonate
chemistry was nearly constant. For instance, we
estimate that the calcite saturation state has varied
by less than ~10%, and pH
T
by less than ~0.04 units
in the surface ocean over the past 10 000 years
(Fig. 2.2B and C). In contrast, since the year 1750
anthropogenic CO
2
emissions have led to a decrease
of surface-ocean pH
T
by ~0.1 units within less than
300 years. If CO
2
emissions continue unabated, sur-
face-ocean calcite saturation state will drop to
about one-third of its pre-industrial value by 2300,
while pH
T
will decline by about 0.7 units (Fig. 2.2B
and C).
(A)
2000
Forecast
1500
1000
Mauna Loa data
500
Ice core data
0
(B)
6
Hindcast
4
2
Forecast
0
(C)
8.2
0
-0.2
-0.4
-0.6
-0.8
Hindcast
8
Ocean data (HOT)
7.8
Forecast
7.6
7.4
-8000
-6000
-4000
-2000
0
2000
Year
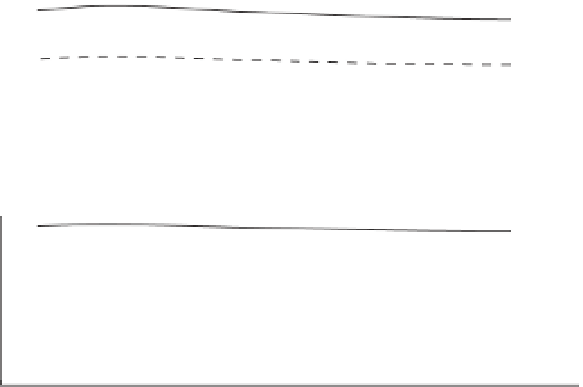
Figure 2.2
Holocene versus Anthropocene. (A) Open diamonds, Holocene atmospheric CO
2
concentrations from ice cores (Monnin et al. 2004 ); blue
diamonds, CO
2
measured at Mauna Loa Observatory, Hawaii (Tans 2009); red line, forecast based on carbon input of 5000 Pg C over ~500 yr using the
carbon cycle model LOSCAR (Zeebe et al. 2008; 2009). (B) Modelled (hindcast and forecast) CaCO
3
saturation state of surface seawater (see text). Solid and
dashed lines: calcite and aragonite saturation. (C) Surface-ocean pH. Lines, model results; green diamonds, Hawaii ocean time-series (HOT) pH data at 25°C
( Dore et al. 2009 ).