Geoscience Reference
In-Depth Information
(A)
(B)
-1.4
-0.4
B(a)
B(a)
B
A2
-1.2
B
B
A2
-0.3
B
-1.0
B
B
B
B(b)
B
B
5.3
-0.8
B(b)
B
4.5
4.5
-0.2
5.3
4.5
4.5
4.5
4.5
4.5
-0.6
B1
4.5
3.7
4.5
4.5
4.5
4.5
B1
4.0
3.5
4.5
4.5
3.7
4.0
3.5
-0.4
-0.1
2.9
2.6
2.9
-0.2
3.2
2.6
3.2
0.0
0.0
AIM
IPAC
IMAGE
MiniCam
EPPA MESSAGE
SRES
AIM
IPAC
IMAGE
MIniCam
EPPA MESSAGE
SRES
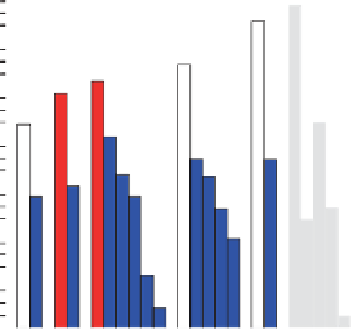
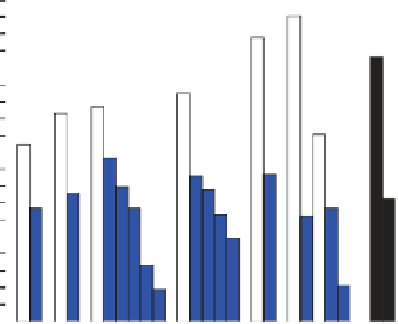
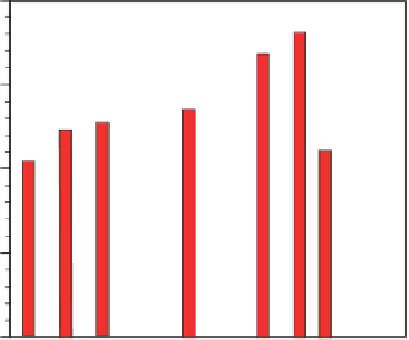
Figure 14.3
21st century change in global-mean surface saturation with respect to aragonite (Ω
a
) and change in global-mean surface-ocean pH
T
for the
range of recent multigas mitigation (blue columns) and baseline (red, 'B') scenarios and the two illustrative SRES scenarios A2 and B1 (black). Numbers
indicate the radiative forcing target in W m
-2
associated with each mitigation scenario. The labels below the columns refer to individual IAMs or to the SRES
scenarios. Results are from the standard set-up of the Bern2.5CC model.
CO
2
. Ω
a
decreases from a pre-industrial value of 3.7
to between 2.3 and 1.8 for the baseline scenarios and
to between 3.1 and 2.4 for the mitigation scenarios
using the standard model parameters. Again, uncer-
tainties in the projections associated with the car-
bon cycle and climate sensitivity are largest for the
high-emissions scenarios and lower-bound pro-
jected Ω
a
becomes as low as a global average of 1.4
for the reference scenario with the highest emis-
sions. Global average surface pH
T
decreases from a
pre-industrial value of 8.18 to 7.88-7.73 for the base-
line scenarios and to 8.05-7.90 for the mitigation
scenarios, with a lower bound value for the most
extreme scenario of 7.6. The uncertainty ranges for
Ω
a
and pH
T
stem almost entirely from uncertainties
in the projection of atmospheric CO
2
as carbonate
chemistry parameters are well dei ned and surface-
water CO
2
follows the atmospheric rise relatively
closely. Trends in surface saturation and pH
T
are
strongly declining in 2100 for the baseline scenarios,
whereas the mitigation scenarios show small or
even increasing trends.
The difference between baseline and mitigation
scenarios is further highlighted by analysing the
overall change in global-mean surface saturation
state and pH
T
over the 21st century (Fig. 14.3).
Surface-ocean mean Ω
a
changes over this century
between -0.1 and -0.8 for the mitigation scenarios
and between -0.9 and -1.4 for the baseline set.
Changes in pH
T
are, with a change by -0.04 to -0.19
units, also much smaller for the mitigation than for
the baseline set (-0.21 to -0.36).
The following conclusions emerge. Mitigation
scenarios decisively lead to lower changes in atmos-
pheric CO
2
, to less climate change, and less ocean
acidii cation. The difference in trends by 2100
implies that 21st century mitigation scenarios have
a higher impact on the additional increase in CO
2
,
the additional warming, and the additional ocean
acidii cation even beyond the 21st century than the
differences between baseline and mitigation sce-
narios reported above for 2100. Assuming that these
scenarios represent a lower bound on feasible emis-
sions reductions, these results represent an estimate
of the 'minimum warming' and of 'minimum ocean
acidii cation' that considers inertia of both the cli-
mate system and socio-economic systems.
14.4 Inertia in the earth system:
long-term commitment to ocean
Simulations in which emissions of carbon and other
forcing agents are hypothetically stopped in the
year 2000 or 2100 allow us to investigate the legacy
effects, i.e. the commitment, of historical and
21st century emissions. Three idealized 'emission-
commitment' scenarios run with the NCAR