Geoscience Reference
In-Depth Information
90
Bromoform CHBr
3
80
70
60
50
40
30
20
10
0
2 4 6 8 0 2 4 6 8 0 2 4
Date in May 2006
(B)
6
Dibromomethane CH
2
Br
2
5
4
3
2
1
0
2
4
6
8
10
12
14
16
18
20
22
24
Date in May 2006
(C)
1.4
Dibromochloromethane CHBr
2
Cl
1.2
1
0.8
0.6
0.4
0.2
0
2
4
6
8
10
12
14
16
18
20
22
24
Date in May 2006
M1
M2
M3
M4
M5
M6
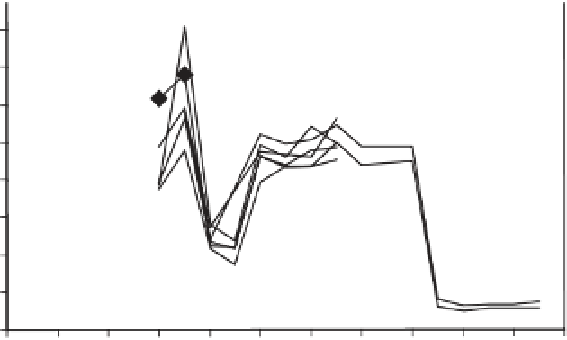
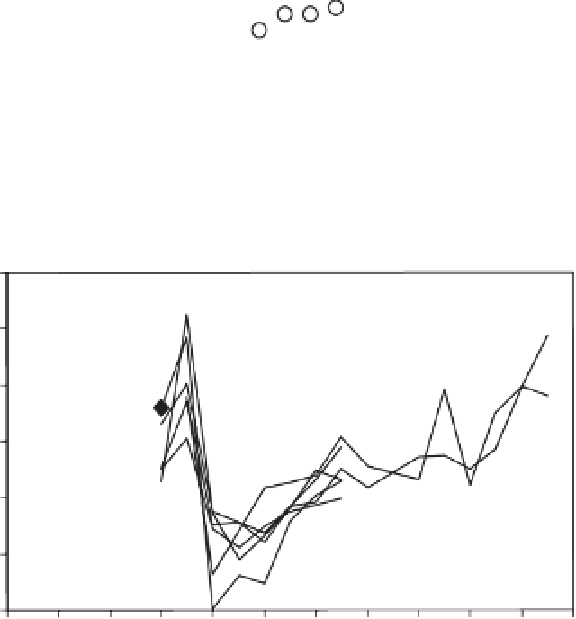
Figure 11.5
Concentrations of bromoform (CHBr
3
) (A), dibromomethane (CH
2
Br
2
) (B), and dibromochloromethane (CHBr
2
Cl) (C) during nutrient-induced
blooms of phytoplankton in mesocosm enclosures in Raunefjord, Bergen, Norway, in May 2006. The nominal CO
2
treatments at the beginning of the
experiment were as follows (M = mesocosm): ~750 μatm in M1, M2, and M3; ~300 μatm in M4, M5, and M6. Data from Hopkins et al. ( 2010 ).