Geoscience Reference
In-Depth Information
(A)
(B)
(C)
60
16
600
2003
DMS
2003
Chlorophyll
a
2003
DMSPp
50
M1
M2
12
40
400
M4
M5
30
8
20
200
4
10
0
0
0
2468 0 2 4 6 8 0 2 4
2468 0 2 4 6 8 0 2 4
2468 0 2 4 6 8 0 2 4
Date in May 2003
Date in May 2003
Date in May 2003
(D)
(E)
(F)
60
16
600
Chlorophyll
a
2005
2005
DMS
DMSPp
2005
50
M4
M5
12
40
400
M6
30
8
M7
M9
M8
20
200
4
10
0
0
0
17
19
21
23
25
27
29
31
2
4
6
17
19
21
23
25
27
29
31
2
4
6
17
19
21
23
25
27
29
31
2
4
6
Date in May/June 2005
Date in May/June 2005
Date in May/June 2005
(G)
(H)
(I)
600
16
60
2006
2006
DMSPp
2006
Chlorophyll
a
DMS
50
M1
M2
12
40
400
M3
M4
M6
30
8
M5
20
200
4
10
0
0
0
2 4 6 8 1012141618202224
2468 0 2 4 6 8 0 2 4
2468 0 2 4 6 8 0 2 4
Date in May 2006
Date in May 2006
Date in May 2006
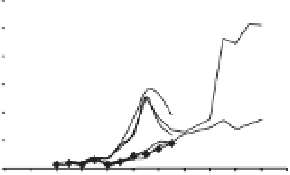
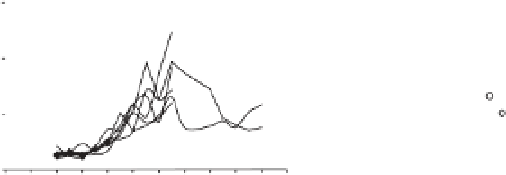
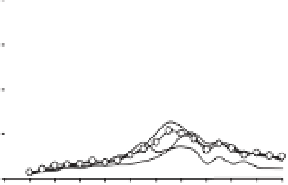
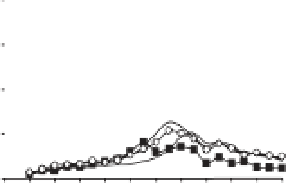
Figure 11.3
Concentrations of DMS, DMSPp (particulate DMSP) and chlorophyll a during nutrient-induced blooms of phytoplankton in mesocosm
enclosures in Raunefjord (Bergen, Norway) in May 2003, May/June 2005, and May 2006. Data from Avgoustidi (2007) (A, B, C), Vogt et al. ( 2008 ) (D, E, F),
and Hopkins et al. (2010) (G, H, I). Nominal CO
2
treatments at the beginning of the experiments were as follows (M = mesocosm): in 2003, ~750 μatm in
M1 and M2, ~380 μatm in M4 and M5; in 2005 ~350 μatm in M4, M5, and M6, ~700 μatm in M7, M8, and M9; in 2006 ~750 μatm in M1, M2, and M3,
~300 μatm in M4, M5, and M6.
only 5.5 × 10
6
cells ml
-1
and with no signii cant dif-
ferences between CO
2
treatments (Riebesell
et al.
2008 ; Vogt
et al.
2008 ). In 2006,
E. huxleyi
was even
less abundant, with maximum numbers of only 3 ×
10
3
cells ml
-1
, but large and signii cant reductions in
abundance under high CO
2
were observed (Hopkins
et al.
2010 ).
Changes in other components of the phytoplank-
ton community also need to be considered. During
the 2003 experiment, a general community shift was
observed in response to high CO
2
, with a signii cant
change in the structure of the autotrophic commu-
nity. The fraction of the community comprising
pico- and nanoplankton appeared to be particularly
sensitive to higher CO
2
concentrations, with poten-
tial impacts on the microbial food web and quality
of the DOM (Engel
et al.
2008). By contrast, no sig-
nii cant differences were observed during the 2005
experiment in either phytoplankton community
composition or bacterial abundance and diversity
( Allgaier
et al.
2008 ; Paulino
et al.
2008 ). In 2006,
most components of the nano- and picoplankton
(coccolithophores, large picoeukaryotes, crypto-
phytes, and
Synechococcus
) were signii cantly lower
under high CO
2
. The overall plankton biomass was
also greatly diminished, with a 28% decrease in
total biomass under high CO
2
, which comprised an
80% reduction in diatom biomass, a 56% reduction
in autotrophic dinol agellate biomass, and a 35%
decrease in ciliates (Hopkins
et al.
2010 ).
These differences in biological characteristics and
community structure, as well as the resilience or