Biomedical Engineering Reference
In-Depth Information
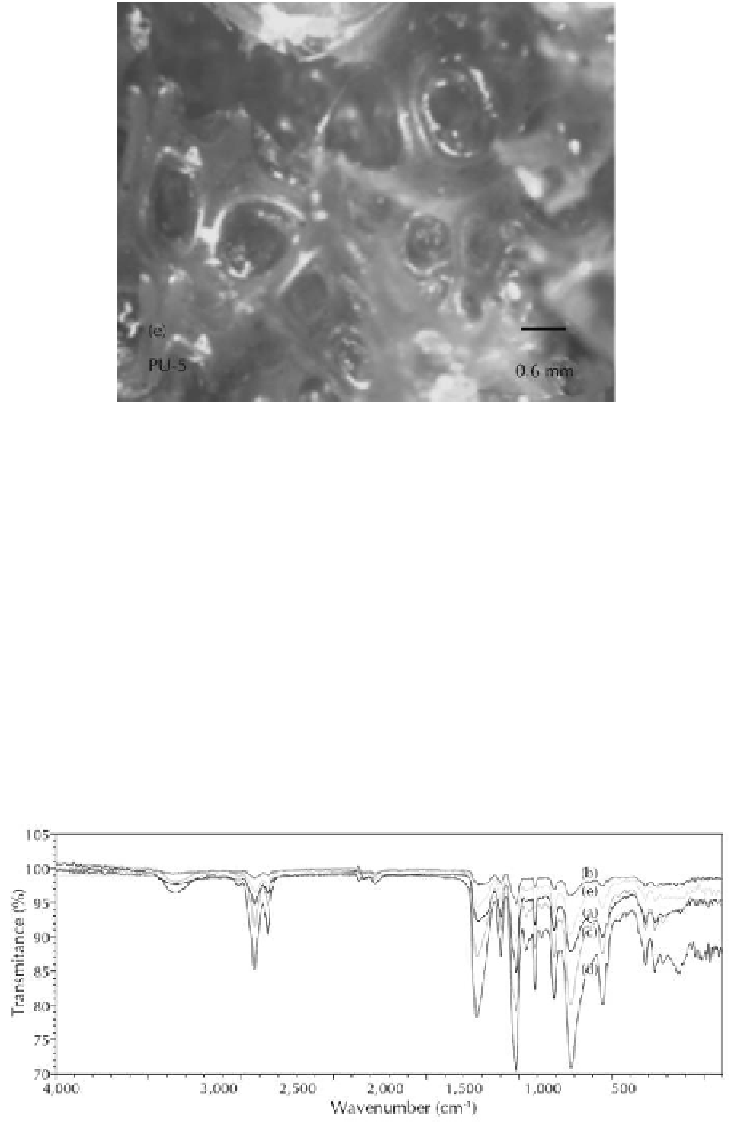
Figure 6.
Magnetic biofoam contained 5%wt of maghemite nanoparticules.
table 2.
Opened porous volumes of the obtained biofoams (PU-1 to PU-4) and biocomposite (PU-5.)
Sample
Volume (cm
3
)
PU-1
2.6 ± 0.2
PU-2
2.0 ± 0.2
PU-3
1.2 ± 0.1
PU-4
0.7 ± 0.1
PU-5
2.0 ± 0.2
The FTIR spectra of the prepared materials can be seen in Figure 7. It can be
noticed that all spectra are similar, indicating that the biocomposites are chemically
comparable, independent on water and toluene diisocyanate amounts. Moreover, the
biofoam PU-4 has more intense characteristic bands.
Figure 7.
FTIR spectra of the (a) PU-1, (b) PU-2, (c) PU-3, (d) PU-4, and (e) PU-5 samples.


Search WWH ::

Custom Search