Biomedical Engineering Reference
In-Depth Information
In order to verify that such a modulation of the BT-HAase activity was not specific
to albumin, we performed experiments with LYS, another non-catalytic protein, pres-
ent together with HA in cartilage. The LYS-dependence curves obtained for various
as the BSA-dependence curves shown on
Figure 6.
This means that, in the same way
as BSA, LYS is able to either enhance or suppress BT-HAase activity according to its
concentration. We also performed experiments with BSA by using exactly the same
experimental conditions as those used to study the effect of the LYS concentration on
the initial rate of HA hydrolysis catalyzed by BT-HAase. The BSA-dependence curves
thus obtained are shown on
Figure 9.
Comparison between the curves on Figures 8
and
9 clearly shows that under the experimental conditions used, LYS had a higher ability
to form electrostatic complexes with HA than BSA since, for any given HA concentra-
tion, the concentration of non-catalytic protein giving the maximum value of the initial
hydrolysis rate was higher for BSA than for LYS. This difference in behavior between
LYS and BSA with respect to their ability to form electrostatic complexes with HA
comes from the difference in their pI values: pI of LYS was estimated to 10.6 (Hoon
Han and Lee, 1997) and that of BSA is close to 5.2 (Wang et al., 1996; Xu et al., 2000).
Thus, at pH 5.25, the net charge of LYS is positive whereas that of BSA is nearly nil.
In fact, the ability of BSA molecules to form electrostatic complexes with HA at pH
5.25 was due to the existence of positive patches on the protein surface (Grymonpré
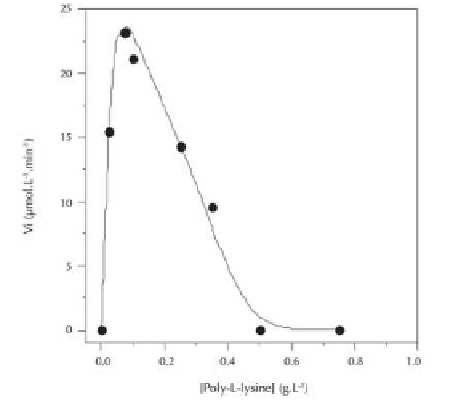
et al., 2001). Moreover, we performed experiments by using poly-L-lysine, a synthetic
polycation, instead of a non-catalytic protein. According to its concentration, poly-L-
lysine was able to either increase or decrease the initial rate of HA hydrolysis (Figure
10). In other words, the presence of poly-L-lysine in the reaction medium had exactly
the same effect on the BT-HAase activity as the addition of the non-catalytic proteins.
Figure 10.
Poly-L-lysine-dependence of the hydrolysis of HA (1 g l
-1
) catalyzed by BT-HAase in 5
mmol l
-1
sodium chloride, at pH 4 and at 37°C, for a BT-HAase concentration of 0.5 g l
-1
. The number
average molar mass of HA was 0.97
×
10
6
g mol
-1
. (Unpublished data).


Search WWH ::

Custom Search