Geography Reference
In-Depth Information
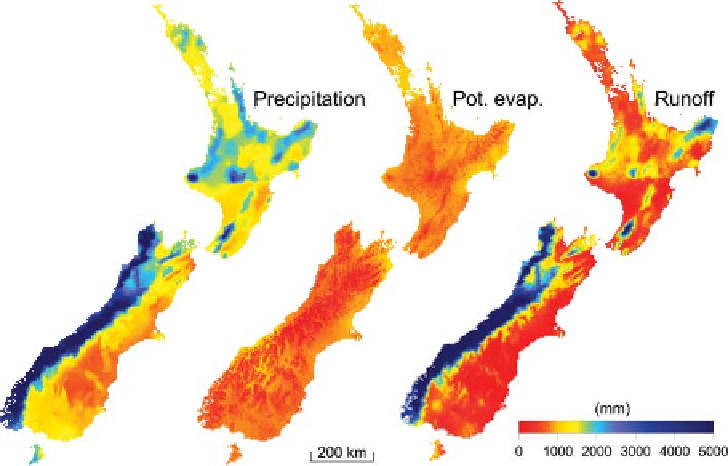
Figure 5.3. Long-term mean
precipitation, potential evaporation
and local runoff (mm/yr) in New
Zealand. From Woods et al.(
2006
).
observed in nature, as in the case of the catchments shown
in
Figure 5.1
. The climate in West Virginia is humid,
which means that on an annual time scale more water
arrives in the catchment than energy can remove it through
evaporation. Therefore the magnitude of annual runoff in
the West Virginian Williams River is always high. In
contrast, Southern California has an arid climate. More
energy is available to evaporate water than precipitation
provides to the catchment. Hence evaporation is high and
mean annual runoff in the Santa Ysabel Creek is low. More
interestingly, the aridity of the climate also determines the
high between-year runoff variability, because of the non-
linearity of the rainfall
in New Zealand, presented on a rectangular grid nationally,
governs spatial variations of mean annual runoff, dividing
New Zealand into relatively wet and dry regions.
The relative availability of water and energy can be
formalised in the form of the aridity index, denoted by
E
p
/P, and defined as the ratio of mean annual potential
evaporation to mean annual precipitation. The aridity index
forms the basis of several empirical relationships between
mean annual evaporation (and hence mean annual runoff)
(Budyko,
1974
; Turc,
1954
). The most famous and widely
used one is that by Budyko (
1974
), which is therefore
called the Budyko curve (Fu,
1981
; Choudhury,
1999
;
Zhang et al.,
2001
; Yang et al.,
2008
). It plots E/P (ratio
of mean annual actual evaporation to mean annual precipi-
tation) as a function of E
p
/P (see
Figure 5.4
for over 331
catchments in Australia; Donohue et al.,
2007
). The
Budyko curve is an empirical relationship, and yet it brings
out a number of principles that are crucial to the organisa-
tion of this topic. First of all, it introduces a key similarity
index, E
p
/P, unique to hydrology, to express the relative
availability of water and energy, and thus helps to classify
hydrological landscapes into various degrees of aridity.
Second, while clearly recognising a certain amount of
scatter, the fact that most catchments of the world (on
average) follow the Budyko curve confirms the signifi-
cance of water
runoff relationship. This is due to
threshold effects (e.g., the fact that, depending on the year,
precipitation can be higher or lower than the potential
evaporation) that mean that small differences in precipita-
tion can translate into much higher differences in runoff,
even at the annual scale. In the Santa Ysabel Creek,
there are many years with zero runoff. In a humid climate,
such as for the Williams River, precipitation always
exceeds potential evaporation at the annual scale, so that
the rainfall
-
-
runoff relationship is more linear and the
between-year variability of runoff is moderate (reflecting
the between-year variability of precipitation).
Differences in annual runoff variability between catch-
ments, to first order, are caused by differences in the relative
availability of water and energy. However, additional factors
are differences in seasonality and storminess of precipitation
events, as demonstrated by Jothityangkoon and Sivapalan
(
2009
) in several Australian and New Zealand catchments.
Figure 5.3
presents a further illustration of how available
water (mean annual precipitation) and available energy
(expressed through mean annual evaporation potential, E
p
)
energy availability as a first-order control
on catchment properties. Other climatic and catchment
factors either (i) contribute to the scatter, or (ii) are them-
selves governed by climate. The relative effects of most of
these factors are included in theoretical frameworks (e.g.,
Milly,
1994a
,
b
; Woods,
2003
).
One climatic factor that does contribute to annual runoff
variability is the relative seasonality of annual precipitation
-
Search WWH ::

Custom Search