Geography Reference
In-Depth Information
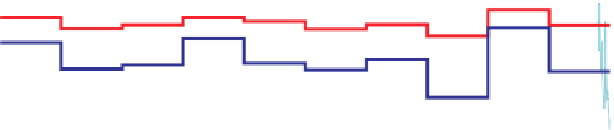
Figure 5.2. Daily precipitation and
runoff time series, with the annual
series superimposed as thick lines.
Here, the seasonal cycle is driven
mainly by potential evaporation.
Data are from the Stanton River at
Cheddar Valley, a 43 km
2
catchment
in north Canterbury, New Zealand.
100
100
10
75
Annual precipitation
1
50
Annual runof f
0.1
25
Daily runof f
Daily precipitation
0.01
0
2000
2001
2002
2003
2004
2005
2006
2007
2008
2009
can be used to group similar catchments. Relationships that
can be used to extrapolate from ungauged to gauged catch-
ments in hydrologically similar (i.e., homogeneous)
regions are developed, and their performance in making
predictions for ungauged basins is reviewed.
(storm and inter-storm) scale up to the seasonal (wet and
dry season) scale. Two distinct phases can be seen in a
catchment
s response to individual precipitation and
melting events: one associated with the wetting phase,
dominated by runoff processes, and another with the
drying phase, when evaporation becomes a dominant pro-
cess. Some processes, such as deep percolation of surface
storages and subsurface drainage, operate continuously
during both phases.
The catchment
'
5.2.1 Processes
Figure 5.2
illustrates runoff variability for a catchment in
New Zealand across a range of time scales, from less than
hourly up to inter-annual variation. Runoff variability at
the annual scale (red line) is an aggregate measure that is
damped compared to the high-frequency variation, but can
be affected to some extent by the presence of event-scale or
seasonal fluctuations. Potentially, the inter-annual fluctu-
ations in runoff could be disaggregated into a component
that directly reflects annual fluctuations in precipitation
and potential evaporation, and a component that reflects
the timing of precipitation, especially in relation to poten-
tial evaporation (Montanari et al.,
2006
), and is sensitive to
higher-frequency variations in rainfall
s response during the wetting phase
depends upon precipitation characteristics (water inputs),
catchment properties, and antecedent wetness, the accumu-
lated net effect of many previous storms. The catchment
'
s
response during the drying phase depends on (i) the water
release characteristics of catchment storage, determined by
topography, geology at long time scales and by soils at
short time scales; and (ii) the evaporation of water between
precipitation events, which depends on the nature, extent
and physiological dynamics of vegetation within the catch-
ment. The history of these interactions over seasonal and
annual periods is embedded in the water balance, but is
also ultimately reflected in the type (e.g., physiology) and
dynamic behaviour (e.g., phenology) of the vegetation
cover, the soil characteristics and the landscape shape,
which co-evolve on time scales from years to millennia.
The next sections describe the processes underpinning
annual runoff variability, including climate forcing, catch-
ment (physical) processes, catchment
'
runoff processes
(Jothityangkoon and Sivapalan,
2009
). The term
evaporation (E) is used throughout this topic to describe
evaporation from free water surfaces, soils and plant sur-
faces, as well as transpiration from vegetation. Another
potential contribution could be the carry-over of soil mois-
ture (and groundwater) storage between years. For
example, Xu et al.(
2012
) showed that this carry-over
could affect annual runoff for catchments dominated by
woody vegetation in Australia. The factors that contribute
to these and their manifestation at the annual scale are
discussed next.
A catchment partitions the sequence of incoming pre-
cipitation events into runoff, evaporation, surface storage
(lakes, snowpack, glaciers etc.) and subsurface storage
(soil moisture, groundwater etc.). This partitioning can be
expressed formally through a water balance equation.
Water balance partitioning can be examined from the event
-
(biological) pro-
cesses and global change.
Climate forcing
Annual water balance and annual runoff variability are
governed, to first order, by the relative availability of water
(precipitation) and energy (evaporation potential), while
subsurface and biological processes modulate these effects.
This suggests that climate is the biggest driver of annual
variability. Differences in the availability of water and
energy can explain much of the annual runoff variability


Search WWH ::

Custom Search