Geography Reference
In-Depth Information
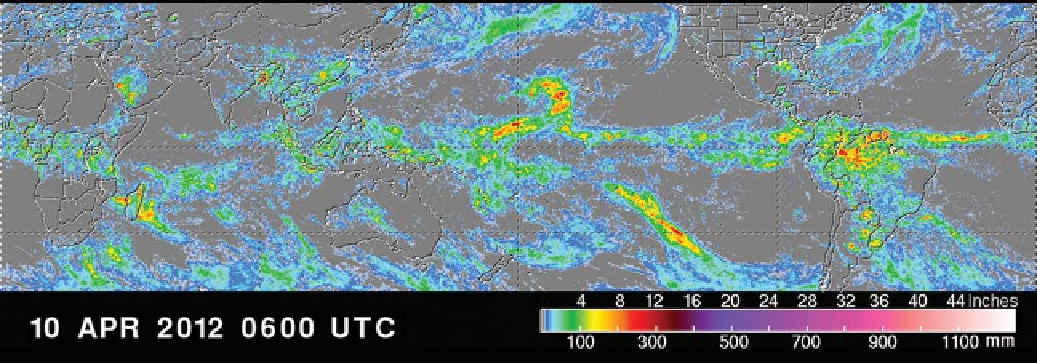
Figure 3.7. Weekly global rainfall accumulation compiled from Tropical Rainfall Measuring Mission (TRMM) data. From
observes tropical rainfall intensities. The final precipitation
product, which is available from the TRMM website, is
composed from various sensors (TRMM and other satel-
lites) and has a spatial resolution of up to 0.25 degrees, but
is limited to 50
Sto50
N. There are products with
different temporal resolutions ranging from 3 hours
to monthly values (Cheema and Bastiaanssen,
2012
).
Figure 3.7
shows the weekly global rainfall accumulation
for April 2012 derived from TRMM. The Global Precipi-
tation Climatology Project (GPCP), which will be the
successor to the TRMM, is a composite database from
various sources including rain gauge data. Daily values
are available at 1 × 1 degree resolution from 1996
to present (Huffman et al.,
2001
). The launch of the Global
Precipitation Measurement (GPM) mission (Uijlenhoet,
2008
) is planned for 2013. GPM will make similar
observations as TRMM, but will cover a larger domain
(80% of the globe) with a higher temporal resolution of
3 hours.
Regional precipitation data: Weather radar networks
play a central role in precipitation monitoring at the
meso-scale, i.e., at regional scale, due to their ability to
obtain spatio-temporal information about precipitation
structure at a much higher resolution than conventional
rain gauge networks (
Figure 3.8
). A weather radar meas-
ures reflectivity, which is directly proportional to the
amount of electromagnetic energy scattered back to the
radar by cloud and precipitation particles (e.g., raindrops,
snowflakes, hail). Quantitative precipitation estimates
(QPE) from radars are typically based on power-law rela-
tionships between rain rate and radar reflectivity. Precipi-
tation estimates obtained by weather radars may be
affected by multiple sources of error (see below); hence,
merging with precipitation data from rain gauge networks
is often seen as a way to combine the large-scale
observation capability of the radar with the point-scale
accuracy of the gauges (Velasco-Forero et al.,
2009
).
An example of a weather radar monitoring network is
provided by the Next Generation Weather Radar system
(NEXRAD) in the USA, which comprises 159 Weather
Surveillance Radar-1988 Doppler (WSR-88D) sites
throughout the USA and at selected overseas locations. In
Europe, the OPERA project aims to provide a European
platform wherein expertise on operationally oriented
weather radar issues is exchanged and data management
procedures (including data exchange) are optimised.
Few studies have been devoted to the statistics of
extreme areal rainfall depths obtained from weather radar
(Morin et al.,
2005
). The increased quality of quantitative
precipitation estimates from radar and the long time series
that have become available have led to a renewed interest
in this kind of research in recent years (Overeem et al.,
2010
).
Local precipitation data: At local scale, rain gauges
provide essential data for hydrological analyses, climato-
logical and statistical investigations, and reference values
to adjust radar-based and satellite-based products. Precipi-
tation is observed at a large number of rain gauges (about
200 000 worldwide) in national meteorological or hydro-
logical networks. Most of the data are used mainly in a
national framework. Data from a subset of the stations
(nominally from 8000 SYNOP stations) is exchanged
globally among the national meteorological services using
the World Weather Watch Global Telecommunication
System (GTS). Monthly accumulated observations are also
globally exchanged as CLIMAT via GTS from nominally
2200 stations. The CLIMAT and SYNOP collections are
partly overlapping. Users can obtain the global, regional or
national synoptic or climate data from the national
meteorological services on request.
Search WWH ::

Custom Search