Geography Reference
In-Depth Information
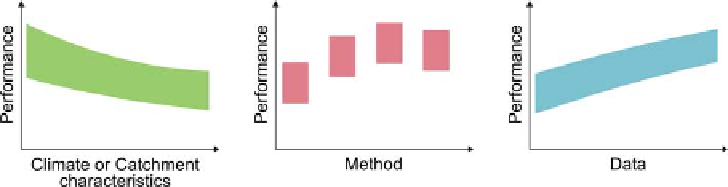
Figure 2.11. Analysis of
performance of a particular runoff
signature (such as annual runoff, the
flow duration curve etc.) with respect
to the controls.
examines the number of stream gauges available in a
particular study as an index to characterise data
availability.
signatures. The difference is then a measure of the model
performance. This
gives an estimate of the
total uncertainty to be expected. It includes all the uncer-
tainty components including input data uncertainty, model
uncertainty and parameter uncertainty (Wagener and Mon-
tanari,
2011
). As a consequence, understanding the per-
formance in a generalised way is a step towards reducing
the uncertainty of the model predictions beyond individual
case studies.
As the differences between predictions and observations
are available for many catchments and (depending on the
signature) for many points in time, it is useful to character-
ise them by statistical metrics or performance measures to
better compare different process controls, prediction
methods and data availability settings. A number of statis-
tical metrics are commonly used in the literature and these
are summarised in
Tables 2.1
and
2.2
. There are a number
of groups of performance measures:
'
blind testing
'
The three types of comparative analyses of the predictive
performance of estimating runoff signatures are illustrated
schematically in
Figure 2.11
. The comparative assessment
figures have been colour-coded throughout the topic to
highlight the different nature of these three types of com-
parative assessment.
2.4.2 Performance measures
The focus of this topic is on predictions of runoff in
ungauged basins. In order to assess the performance of
the predictive methods, predicted runoff signatures in
ungauged basins need to be compared to observed runoff
signatures. This type of assessment is most often achieved
by a split sample technique, breaking a data set into two
parts, using one for estimation of the model parameters and
the remainder for the assessment of the predictions (Kleme
Measures of bias are indicators of whether the average
of the differences between predictions and observations
is close to zero. Bias can be positive and negative and a
bias of zero implies perfect prediction with respect to
bias. It is an important aspect of model performance
since it describes the mass balance error of runoff.
,
1986b
). This means that the model used to estimate runoff
in the ungauged basins does not use runoff information
from that basin. The catchment is treated as ungauged. Only
after the runoff prediction has been made are the runoff
observations used for the assessment. However, local obser-
vations of climate and catchment characteristics can be used
in the catchment of interest. This procedure allows for an
independent cross-validation of each methodology used to
provide predictions in ungauged basins, rather than enabling
just a goodness of fit of a particular regionalisation method.
Often, it is useful to perform this cross-validation for all
catchments in a region. In this case, a leave-one-out strategy
is adopted where, first, one of the catchments is treated as
ungauged and the runoff signatures estimated from runoff
from the other catchments in the region as well as the
climate and catchment characteristics. The model
š
Measures of random errors are indicators of spread of
the differences of predicted and observed runoff signa-
tures. A random error of zero implies perfect predictions
with respect to random errors. An example is the root
mean square error which has the same units as the runoff
signatures that are being compared.
Correlation coefficients denote the strength of the asso-
ciation between predicted and observed runoff signa-
tures. There are two types here (r² and R²). r² describes
what fraction of the data variability can be explained by
a linear relationship with the predictions. A correlation
of 1 implies perfect linear association of the observed
and predicted pattern although the mean and the
variability can be quite different from those of the data.
R² describes what fraction of the data variability
can be explained by the predictions themselves. R²of
1 implies that the predictions and the observations are
identical.
spredict-
ive ability is then tested on the catchment that was left out.
The procedure is then repeated for all catchments within the
region in turn, allowing for a full cross-validation and
optimal use of all available data.
In each case, the model performance is assessed by
comparing predicted runoff signatures in the catchments
treated as ungauged basins with the observed runoff
'
Search WWH ::

Custom Search