Geography Reference
In-Depth Information
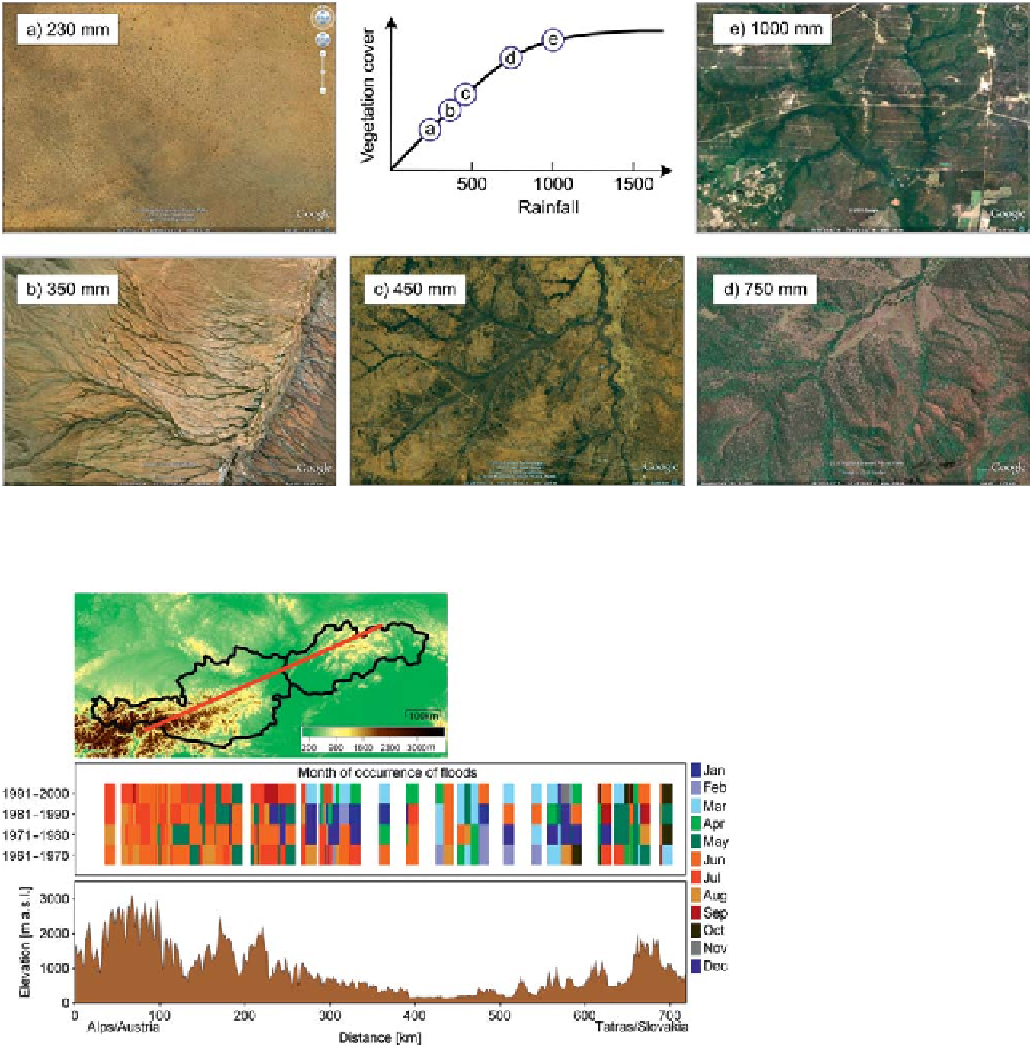
Figure 2.5. Vegetation patterns for different regions in Australia with annual precipitation ranging from 230 to 1000 mm. From Thompson et al.
(
2011
).
Figure 2.6. Season (month) of the
occurrence of floods along a transect
Austria
Slovakia in the decades of
the period 1961
-
2000. Bottom panel
shows the elevation of the transect.
From Parajka et al.(
2009a
).
-
Figure 2.6
shows another example to illustrate what can
be learned through comparing and contrasting many catch-
ments; knowledge that is impossible to obtain otherwise. It
presents, along a transect across Austria and Slovakia, the
time of the year that floods have occurred, revealing inter-
esting differences and similarities, even though most of the
precipitation occurs in summer in the entire region. In the
Alpine catchments in the west, floods are summer-
dominated, while in the lowland catchments in the centre
of
because of the seasonal interplay of soil moisture dynamics
and flood generation processes. In summer, the lowland
soils tend to be very dry, while in winter they are much
wetter, thus favouring flood occurrence. It is also interest-
ing to see how winter floods move further up in elevation
as the climate gets warmer (at location 300 km).
The approach of analysing many catchments in a synop-
tic way, as in the two previous examples, has been termed
'
by Falkenmark and Chapman
(
1989
). Rather than modelling a single catchment in detail,
comparative hydrology
'
the cross-section, winter
floods dominate. This is
Search WWH ::

Custom Search