Geography Reference
In-Depth Information
1.0
a)
b)
1.0
D
p
/
D
p
*(drainage density)
0.8
0.8
0.6
0.6
0.4
Q
/
P
( Budyko)
0.4
0.2
0.2
0.0
0.0
0
1
2
3
4
5
1
2
3
4
5
E
p
/
P
E
p
/
P
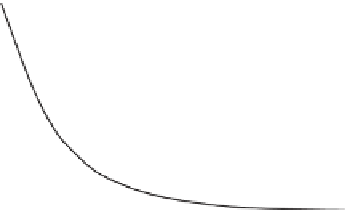
Figure 12.9. (a) Perennial stream density (D
p
) normalised by its maximum D
p
* versus aridity for 185 catchments in the USA (points)
compared to mean runoff coefficients from the Budyko curve (line). From Wang and Wu (
2012
). (b) Ratio of deep-rooted vegetation to
total vegetation versus aridity for 193 catchments in Australia. Adapted from Xu et al.(
2012
).
Studies from the literature in support of evidence for
co-evolution
The idea of catchments as organisms that have reached their
current state through co-evolution naturally points towards
a comparative hydrology, with differences between differ-
ent catchments and regions being seen as a manifestation of
the different trajectories of co-evolution they may have
followed. Therefore, there is much to be learned from the
study of the similarity and differences of catchments,
including the differences in the underlying controls, as these
can ultimately help us to make improved predictions.
In the same way as the Budyko curve represents how the
co-evolution of climate, soil, vegetation and topography
explains annual runoff, the drainage patterns evident in the
landscape can also be seen as a Darwinian pattern. On the
one hand, drainage density determines the amount and
timing of runoff generated by a catchment. On the other
hand, it is the result of the processes whereby runoff is
generated, and is hence governed by both the water balance
at a range of scales and the vegetation patterns that develop.
Wang and Wu (
2012
) pointed out the symmetry between
water balance and drainage density patterns. They plotted a
scaled drainage density in catchments across the USA (data
taken from the National Hydrography Dataset) against the
aridity index (
Figure 12.9a
) and found that density strongly
decreases with aridity (for very arid places, the scaled drain-
age density is low). There are, apparently, feedbacks
between climate, hydrology and landscape-forming pro-
cesses that lead to the good explanatory power of aridity.
The interesting point of their comparison is that their rela-
tionship between scaled drainage density and the aridity
index is, in fact, very similar to the relationship between
the annual runoff coefficient and aridity index (
Figure 12.9
).
A similar study for the case of vegetation
(
Xu et al.,
2012
)
found that the ratio of deep-rooted vegetation to total vege-
tation decreased with aridity (for very arid places, most
vegetation is shallow rooted, see
Figure 12.9b
). Again, co-
evolutionary feedback processes appear to be involved,
causing different plant species to grow in response to cli-
mate patterns, which in turn affect the water balance of the
catchments. These two examples illustrate that co-
evolutionary feedback processes may be very relevant for
hydrology at
large.
In general,
there are three co-
evolutionary features
-
runoff, drainage density and vegeta-
tion cover
-
and they all appear to be interconnected.
12.3.2 Comparative hydrology and the Newtonian
-
Darwinian synthesis
As indicated at the beginning of this topic (
Chapter 1
), our
goal here has been to carry out a synthesis based on studies
of predictions in ungauged basins, by organising it along
processes (runoff signatures), places (climate gradient) and
scales (catchment area and data richness). Interesting pat-
terns have emerged through this synthesis. In particular,
the comparative analyses of prediction performances and
their hydrological interpretation have indicated strong
elements of both the Newtonian and Darwinian approaches
to be applicable to predictions in ungauged basins (PUB).
When signatures are explored from a mechanistic or
process perspective, exploring their process controls as a
way to assist in their prediction, this represents the best
aspects of the Newtonian approach. In this case, we follow
the cascading of the variability in the climatic inputs
through the catchment system, through interactions with
the heterogeneity and structure of the catchment system, in
this way contributing to process complexity and richness,
and manifesting in the runoff variability that we see in the
observed records. When this is repeated in several places,
and assessed comparatively, this can contribute to a gener-
alisation of our understanding of runoff variability. On the
other hand, by performing comparative assessment of vari-
ous prediction methods in a synoptic manner, across a
population of catchments in a region or around the world,


Search WWH ::

Custom Search