Geography Reference
In-Depth Information
Table 12.1. Method types used in the Level 1 and Level 2 assessments of
Chapters 5
10
-
Ch. 5
Annual
Ch. 6
Seasonal
Ch. 7
FDC
Ch. 8
Low flows
Ch. 9
Floods
Ch. 10
Hydrographs
Level 1
number of
studies
34 (40)
13 (26)
13 (25)
27 (29)
31 (49)
33 (75)
Level 2
number of
studies
2
4
7
8
5
9
Level 1
number of
catchments
12 141
643
1486
3200
3809
3554
Level 2
number of
catchments
1081
1641
1419
2455
1740
1832
Level 1
methods used
statistical,
process-based
statistical,
process-based
statistical
statistical
statistical
process-based
Level 2
methods used
global
regression
statistical,
process-based
statistical,
process-based
statistical
statistical
process-based
Level 1 refers to an assessment of the average performance of studies, Level 2 to an assessment of the performance for individual
catchments. For Level 1/number of studies, the number of papers is given, and in brackets the number of results.
assessments to seek a deeper insight into the performances
of predictive techniques.
About 25 000 catchments in 151 studies were analysed
in the L1 assessment, and 10 000 catchments in the L2
assessment (
Table 12.1
). In most cases, statistical methods
were used to predict runoff signatures in ungauged basins.
Runoff hydrographs, however, were generally predicted
with the use of process-based methods, such as conceptual
rainfall
runoff models.
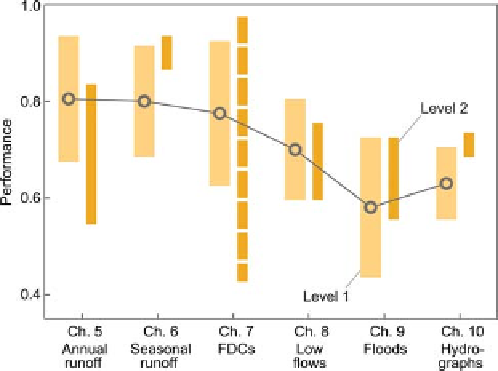
Figure 12.3
shows a summary of the cross-validation
performance of runoff predictions in ungauged basins. For
each of the signatures, assessment results from all studies
and all methods were grouped together, and the 25% and
75% ranges from L1 and L2 assessment studies are shown
separately. The results in the figure are all for blind tests,
i.e., assuming no local runoff data were available. Overall,
the L1 and L2 assessment results are consistent. However,
there are some differences, which can be explained by
differences in the selection of the catchments and/or per-
formance measures used. For annual runoff the r² perform-
ance of the L2 assessment is lower than that of L1. This is
because L2 is the aggregated result of a number of studies
in different regions around the world, most of which were
geared towards representing the particular characteristics
of annual runoff in that region. L1, on the other hand,
mainly consists of a global comparison where annual run-
off was predicted globally with the same set of catchment
characteristics, which yielded a lower performance than the
dedicated studies. For seasonal runoff, the L1 results are
from a mix of different performance measures, while in the
L2 performance has been measured by the Nash
-
Figure 12.3. Comparison of cross-validation performance of
prediction methods for different signatures. Ranges show
approximate 25% and 75% ranges of results from Level 1 and Level 2
assesments. The figure is based on a total of about 25 000 catchments
around the world. All are blind tests, i.e., assuming no local runoff
data were available. Light orange bands: Level 1 (grey line is
mid-point of the range for Level 1); dark orange bands: Level 2.
tends to be significantly higher than other performance
measures. For flow duration curves, again, L1 is a mix of
different performance measures, while in the L2 perform-
ance two measures were used: the NSE of the quantiles of
the scaled flow duration curve which always gives results
close to 1, and the R² of the slope of the flow duration
curve which gave much lower values. The bar in
Figure
12.3
is indicative that, in fact, the spread between the two
measures found in L2 is even larger (see Section 7.5). For
low flows, the results of L1 and L2 are fully consistent, as
Sutcliffe
efficiency (NSE) of the Pardé coefficients (i.e., mean
monthly runoff scaled by mean annual runoff), which
-


Search WWH ::

Custom Search