Geography Reference
In-Depth Information
General parameters
R
E
G
I
O
N
A
L
I
S
A
T
I
O
N
Evaporation
Snow density
Soil parameters
Precipitation
correction with
altitude
Rivers
outlet
Water holding
characteristics
Land-use parameters
Control data:
Several rivers
discharge to sea
Infiltration,
percolation,
recession, surface
runoff
Control data:
Evaporation
River parameters
Water balance
Snow pack and
distribution
Regional runoff
Snow melt
Surface runoff
Lake
parameters
Flood peak speed
(N, P, TOC conc.)
Control data:
Control data:
Flow paths (soft
data)
Fluctuation of
groundwater level
Runoff from
headwaters
(N, P, TOC conc.)
Flow paths (soft
data)
Fluctuation of
groundwater level
Runoff from
headwaters
Control data:
Rating curves
Regulation routines
Transit-time
Runoff along river
reaches
(N, P, TOC conc.)
Control data:
Lake level
dynamics
Runoff downstream
lakes
(N, P, TOC conc.)
(N, P, TOC conc.)
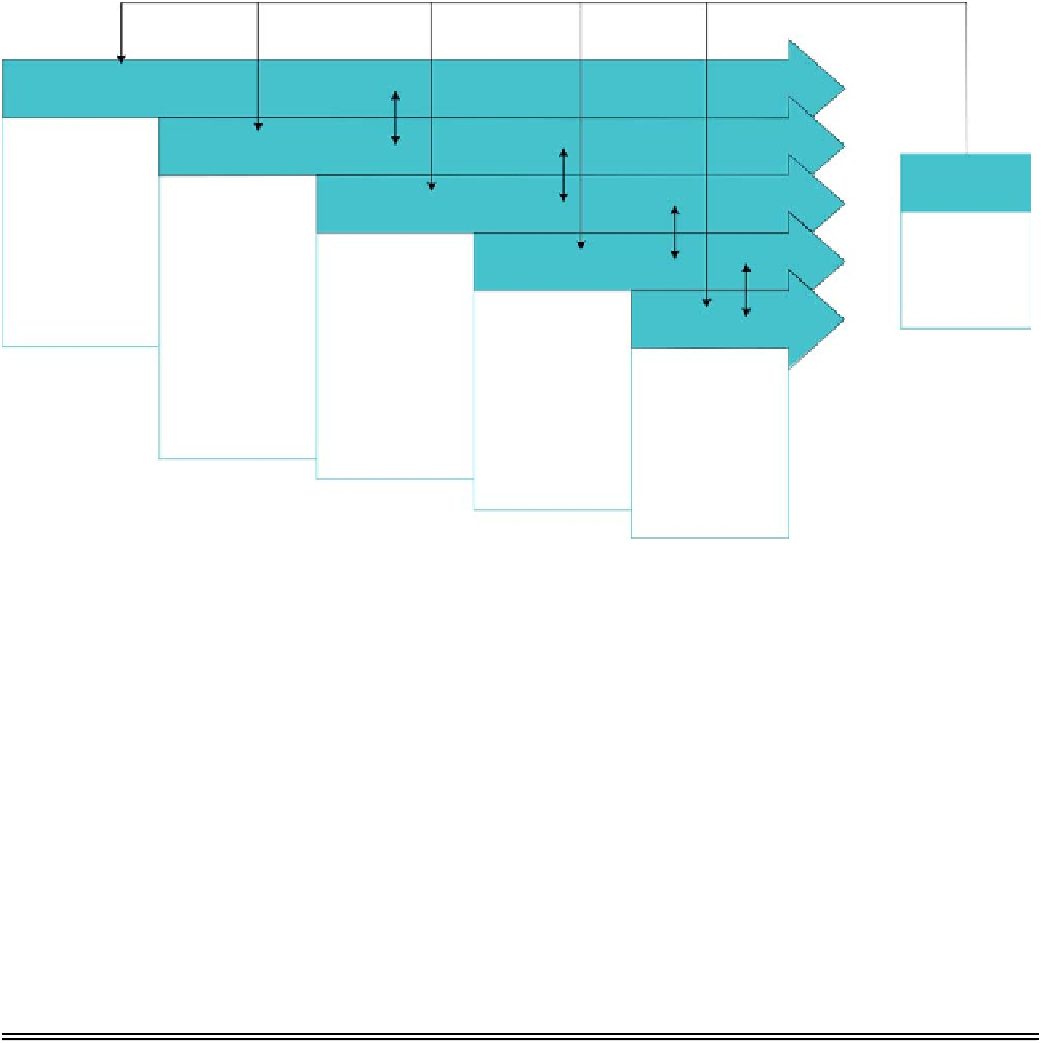
Figure 11.89. The scheme of the stepwise calibration procedure starting from the left with simultaneous multi-basin calibration. Parameters of
specific processes or groups of processes are calibrated against control data (i.e., observations or soft data) and fixed before continuing with the
next step along the model structure. Water and nutrient concentrations are calibrated iteratively and reconsideration of previous choices of
parameter values is sometimes necessary.
Table 11.22. Model performance of river runoff from catchments of various sizes and disturbance, and at all
gauging stations
Catchment size
Disturbance
ALL
<
200
200
-
2000
>
2000
Natural
Regulated
Regional calibration
No.
61
47
12
91
29
120
NSE
0.68
0.76
0.72
0.72
0.40
0.70
RE
−
3
−
6
−
4
−
3
−
6
−
4
Independent validation
No.
41
124
121
114
172
286
NSE
0.66
0.69
0.49
0.78
0.45
0.62
RE
3
0
1
1
1
1
Some of the gauges were used for the regional calibration of the S-HYPE model or were given a specific rating curve. Others can be
considered as ungauged (Validation sites).
Median values of Nash
-
Sutcliffe efficiency (NSE) and average relative volume error (RE) (%) are given.
made for catchments of various sizes, disturbances, soil
types and land uses (Tables
11.22
and
11.23
). It is difficult
to compare these results as the number of catchments in
each category differs, and due to differences in variance in
discharge between basins. It should also be noted that the
evaporation was adjusted by checking the overall water
balance for the whole country and therefore the volume
error is relatively small also for validation sites.
The median values of NSE were rather stable between
gauged and ungauged basins. For natural rivers, the aver-
age NSE was higher for the large amount of independent
validation sites (i.e. ungauged basins). This is mainly an
effect of size since the calibration was performed on small
headwaters. In total, average model performance was
lower than the medians as a few stations were poorly
simulated by the model. This could be caused by bad


Search WWH ::

Custom Search