Geography Reference
In-Depth Information
1
1
AWBM
IHACRES
Sacramento
Simhyd
SMAR−G
AWAP
AWRA−L
Cable
Simhyd (
n
=5)
Simhyd (
n
=1)
SMAR−G (
n
=5)
SMAR−G (
n
=1)
0.9
0.9
0.8
0.8
0.7
0.7
0.6
0.6
0.5
0.5
0.4
0.4
0.3
0.3
0.2
0.2
0.1
0.1
0
0
0
0.1
0.2
0.3
0.4
0.5
0.6
0.7
0.8
0.9
1
0
0.1
0.2
0.3
0.4
0.5
0.6
0.7
0.8
0.9
1
Cumulative frequency
Cumulative frequency
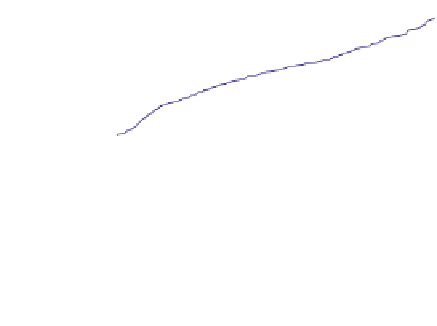
Figure 11.80. Cumulative distribution of monthly validation
efficiencies for eight models.
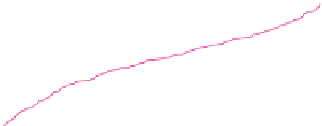
Figure 11.81. Cumulative distribution of monthly efficiency for two
models using nearest-neighbour regionalisation and an average of
regionalisation using parameters from the nearest five gauged
catchments.
daily predictions derived from parameters calibrated on not
just the nearest catchment (as in the case of the regionalisa-
tion described above), but from the nearest five catchments.
Again the ensemble is unweighted.
from the five nearest catchments is used. Similar results
occur for the other three lumped models. It is clear
that introducing information from more than one nearby
catchment improves model predictions. This improvement
of multi-donor ensembles over nearest-neighbour region-
alisation may be especially true in regions with high hydro-
logical heterogeneity, where the nearest neighbour may not
necessarily be the most appropriate donor, but the average
of the five nearest donors provides a better representation
of the target catchment.
Results
Model comparisons
There is little difference in performance of the five lumped
models when regionalised using parameters from the
nearest-neighbouring catchment (
Figure 11.80
). Despite
this, it is evident that Sacramento gives slightly better
monthly efficiencies than the other models. This is pos-
sibly due to it having more parameters available for opti-
misation. In contrast, the continental-scale models are
considerably poorer, with AWAP typically being better
than AWRA-L and AWRA-L better than CABLE. Similar
conclusions on relative model performance can be drawn
from analyses of daily efficiency and bias (not shown),
although AWRA-L tends to have less prediction bias than
AWAP, for which there is a strong tendency towards
overprediction.
The evidence of
Figure 11.80
strongly argues for
continental-scale runoff predictions to be made using
regionalised lumped models. Predictions from these
models are likely to be significantly better than those of
the three continental-scale models.
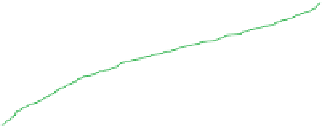
Multi-model averaging
A multi-model average con-
structed from the five lumped models tends to provide
monthly predictions that are as good as or slightly better
than those of the best individual model (
Figure 11.82
).
This improvement tends to be even more pronounced for
daily efficiencies (not shown) and is particularly noticeable
in the lower half of the cumulative distributions, where it is
apparent that predictions in the catchments that each of the
spatialised models
simulate poorly are
significantly
enhanced by model averaging.
The prediction efficiency of an eight-model average is
also shown in
Figure 11.82
. This ensemble combines pre-
dictions from the five spatialised models
-
which are
usually closely matched
with predictions from the three
continental-scale models, which can be significantly
poorer. Nonetheless, the monthly efficiencies for this
ensemble are typically better than or equal to those of the
five-member ensemble and the best of the spatialised
models, especially in the lower half of the cumulative
distributions.
-
Multi-donor averaging
Differences in performance
between regionalisation using nearest-neighbour param-
eters only and that using an average of predictions using
parameters from the nearest five catchments are shown in
Figure 11.81
for two lumped models. In both cases there is
significant improvement in performance when information


Search WWH ::

Custom Search