Geography Reference
In-Depth Information
Table 11.19. Correlation coefficients between Pitman
model parameters and flow statistics and basin descriptors
2500
2000
Flow statistic/basin descriptor
S
cap
FT
1500
Average annual runoff
0.40
0.74
1000
Baseflow index
0.60
0.77
One-day recession coefficient
0.40
0.76
500
q
90
0.61
0.73
q
20
0.54
0.71
0
Average annual rainfall
0.66
0.64
0
500 1000 1500 2000
Average annual evaporation (mm/year)
2500
Average annual pan evaporation
−
0.58
−
0.40
S
50
0.39
0.58
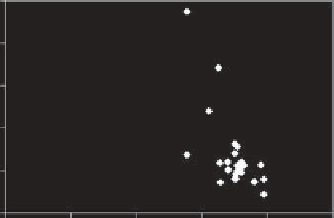
Figure 11.77. The relationship between parameter B of the ABCD
model and average annual pan evaporation.
1.0
Hughes (1997b)
inferred that it was possible to region-
alise parameters of this model but without having done a
quantitative analysis. This study raises doubts about the
possibility of regionalising parameters of the version of the
Pitman model used in this study.
0.8
0.6
0.4
0.2
Discussion
The most important flow statistics (average annual runoff,
daily flows of specified exceedance frequency, and base-
flow index) could be predicted using basin descriptors. The
most important basin descriptors are average annual run-
off, basin slope indices and average annual pan evapor-
ation. Some of the basin descriptors have non-linear
relationships with flow statistics, and neural networks pro-
vided predictions better than those made using multiple
regression equations.
The delineation of river basins using basin descriptors
into hydrologically homogeneous groups did not improve
prediction of flow statistics. It is likely that the river basins
considered already fall within a homogeneous group and
further subdivision distorts relationships between basin
descriptors and flow statistics.
Equifinality of model parameters was found to exist in
both of the two conceptual models used. The cause of this
is partly due to the structure of these models, which have
parameters that interact with each other. A further cause of
equifinality is the non-existence of a global optimum par-
ameter value but several sub-optima. Two parameters of
the simple ABCD model could be predicted from basin
descriptors, specifically those influencing subsurface flow
contributions. Regionalisation of the more complex Pitman
model was, however, not successful. Subsequent studies
by Kapangaziwiri and Hughes (
2008
) demonstrated the
possibility of regionalising parameters of this model.
Kapangaziwiri and Hughes (
2008
) did, however, use an
improved version of this model with explicit routines for
groundwater.
0.0
0.0
2.0
Drainage density (km/sq km)
4.0
6.0
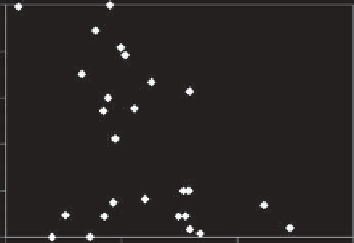
Figure 11.78. Relationship between parameter D of the ABCD model
and drainage density.
For the ABCD model, parameters B and D had some
relationships with basin descriptors. Parameter B, which is
the maximum amount of precipitation and soil moisture
available for evaporation, was found to be related to the
average annual pan evaporation (
Figure 11.77
).
Parameter D, which determines the proportion of
groundwater storage to be discharged into rivers, had a
relationship with drainage density (
Figure 11.78
). The
study area is underlain by the basement complex in which
groundwater storage is mainly due to fracturing and
weathering. Fracturing and weathering tend to facilitate
formation of rivers causing an increase in drainage density.
Figure 11.78
shows basin C6 to be an outlier in the rela-
tionship between parameter D and drainage density. This
basin differs from all the others by being dominated by
Upper Karoo sandstone, which does not commonly occur
in the other basins. D27 and D28 have over the years been
subjected to cultivation and abstraction of water for irriga-
tion, which possibly explains their outlier behaviour.
Pitman model parameters did not show clearly
defined relationships with basin descriptors. Some of
the parameters had relationships with flow statistics
(
Table 11.19
).


Search WWH ::

Custom Search