Geography Reference
In-Depth Information
150
200
150
100
100
50
50
0
700
0
750 800
Rainfall (mm/yr)
850
550
600
650
700
750
Rainfall (mm/yr)
Cluster 1
Cluster 2
300
350
300
250
250
200
200
150
150
100
100
50
50
0
0
800
850
900
950
1000
1100
1200
1300
1400
Rainfall (mm/yr)
Rainfall (mm/yr)
Cluster 3
Cluster 4
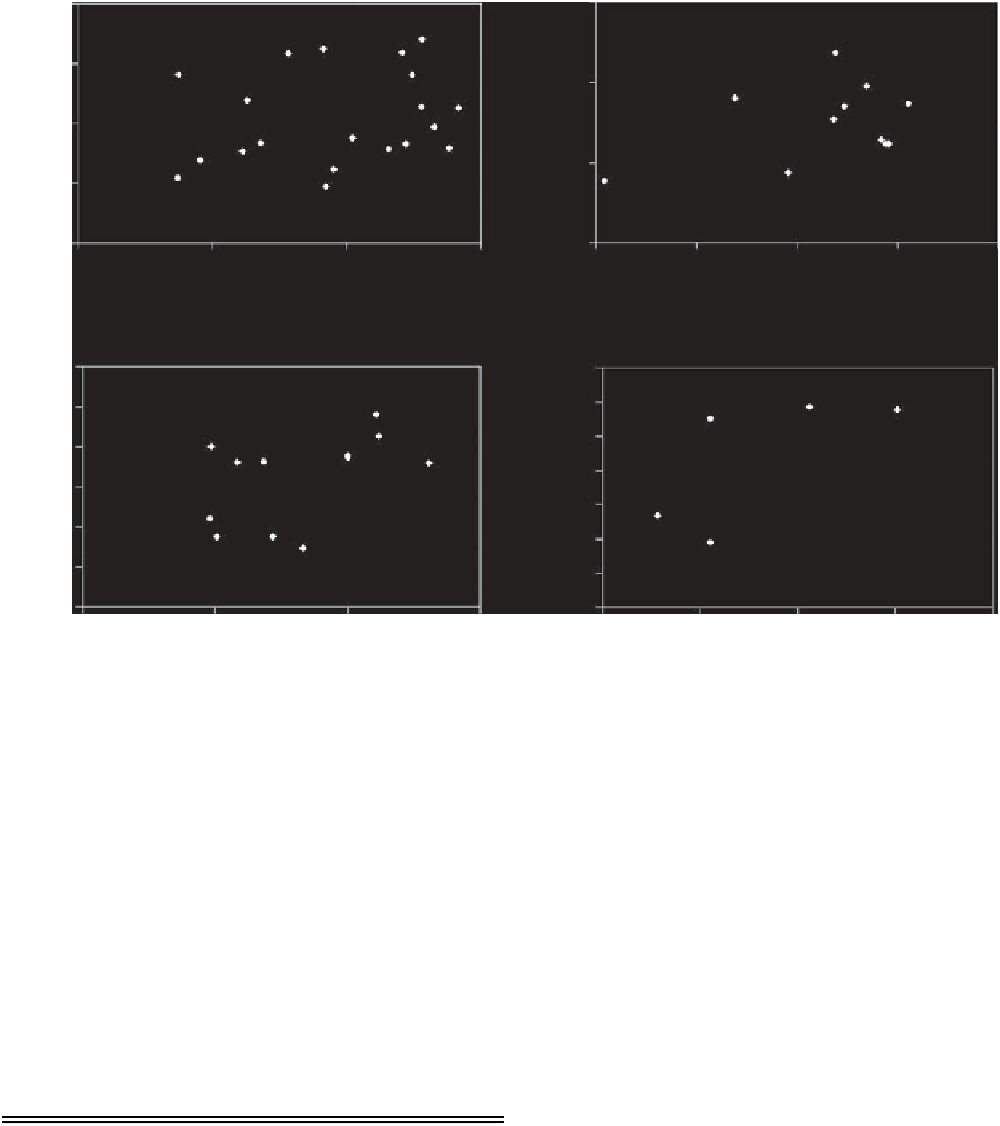
Figure 11.76. Relationship between mean annual runoff and mean annual rainfall for the four clusters derived using basin descriptors.
Table 11.18. Illustration of equifinality of Pitman model
parameters on C25 with two sets of parameter values
producing monthly flows with similar flow statistics
Table 11.17. Illustration of equifinality of parameters of
the ABCD model on basin E49 that has four different sets
of parameters resulting in simulated monthly flows with
similar statistics
Set 1
Set 2
Parameter
Set 1
Set 2
Set 3
Set 4
2.1
346.6
21.4
22.9
1151.0
2.7
343.3
35.0
25.9
1205.6
POW
S
cap
FT
Z
min
Z
max
A
B
C
D
0.9799
504.5
0.2807
0.8163
0.9852
571.4
0.2807
0.0000
0.9780
558.3
0.1566
1.0000
0.9766
618.1
0.0000
1.0000
% Difference in the mean
% Difference in the standard deviation
Coefficient of efficiency
−
3.3%
−
5.6%
0.81
2.5%
−
3.6%
0.81
Mean (10
6
m
3
)
Std Dev (10
6
m
3
)
Coef. eff.
7.55
14.20
0.89
7.55
12.66
0.87
7.55
13.82
0.89
7.55
13.32
0.89
flows. The two rainfall
runoff models had problems simu-
lating such decadal changes in dry season flows because
groundwater storage and flow were not fully described by
these models.
Equifinality of model parameters was encountered in
both model applications (Tables
11.17
and
11.18
). Equi-
finality of model parameters can be due to the structure of
-
the model, which allowed for interactions between some
parameters. Some of the Pitman model parameters were
found to interact amongst themselves, which impacted on
the flow simulations. The development of relationships
between model parameters and basin descriptors becomes
problematic due to parameters having no unique values for
given physical conditions.


Search WWH ::

Custom Search