Geography Reference
In-Depth Information
1000
150
Min
Min
125
800
Average
Max
Average
100
Max
600
75
400
50
200
25
0
0
1
2
3
Cluster
4
5
1
2
3
Cluster
4
5
1.0
300
Min
Min
Average
Max
250
0.8
Average
200
0.6
Max
150
0.4
100
0.2
50
0.0
0
1
2
3
Cluster
4
5
1
2
3
Cluster
4
5
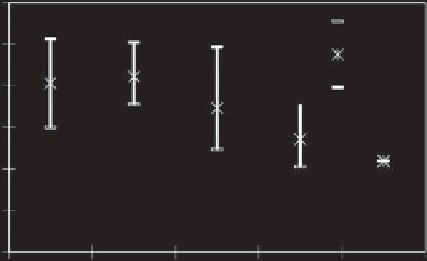
Figure 11.75. Variation of flow statistics among the five clusters derived using basin descriptors.
The number of hydrologically homogeneous groups of
river basins identified using cluster analysis varied from
two to eight. Cluster analysis was also carried out using
flow statistics. A comparison was then made about the
group membership between clusters based on basin
descriptors and those derived using flow statistics. The
high level of agreement between clusters based on basin
descriptors and those from flow statistics was used to
determine the number of clusters that represented hydro-
logically homogeneous regions. The Rg index (Everitt,
1993
) was used to assess this level of agreement. Five
groups of river basins gave the highest level of agreement,
implying that these groups represented hydrologically
homogeneous regions. The clusters varied from basins
with low runoff in cluster 1 to high runoff in cluster 5
(see
Figure 11.75
).
The prediction of flow statistics from basin descrip-
tors, however, did not improve with clustering, as is
shown by the lack of a relationship between average
annual runoff and average annual rainfall in
Figure
11.76
. The possible reason may be that the clustering
resulted in delineation of basins into groups with narrow
ranges in the variation of basin descriptors and possible
flow statistics, which constrained the development of
predictive equations.
Regionalisation of conceptual models
There were 30 basins that had adequate data for calibrating
and validating the two conceptual models. A comparison
of the observed and simulated monthly flows showed that
the N-S coefficient of efficiency was greater than 0.70 on
70% of the 30 basins for both models. Monthly flows
simulated using the ABCD model had both the mean and
standard deviation falling within the acceptable range of
80% of the basins, while this was 90% for the Pitman
model. Multi-decadal variability in rainfall resulted in the
occurrence of several years with generally above average
rainfall (e.g., the 1970s), and consequently an accumula-
tion of groundwater, leading to high dry season flows
during this period. This was followed by generally low
rainfall during the 1980s and 1990s resulting in reduced
accretion of groundwater and therefore low dry season


Search WWH ::

Custom Search