Geography Reference
In-Depth Information
Table 11.15. Maximum, mean and minimum values of some of the basin descriptors and flow statistics for the 52 selected
river basins
Basin descriptor
Mean
Max
Min
Basin area (km
2
)
505
2630
3.5
Average annual rainfall (mm/yr)
852
1797
554
Number of rainy days per year
71
126
45
Average annual US Class A pan evaporation (mm/yr)
1795
1946
1388
Median basin slope (%)
5.3
17.6
1.5
Drainage density (km km
−
2
)
2.4
4.9
0.2
Average annual runoff (mm/yr)
140
778
39
Coefficient of variation of annual runoff (%)
95
133
52
Baseflow index
0.36
0.78
0.08
One-day recession constant
0.90
0.96
0.83
Runoff coefficient
0.15
0.43
0.06
q90
0.02
0.26
0.00
q70
0.08
0.47
0.00
q50
0.19
0.71
0.00
q20
0.85
1.47
0.19
q10
1.99
2.94
0.80
q90 is the daily flow with a 90% exceedance frequency normalised by the average daily flow.
observed and simulated monthly flows being within ±10%;
(iii) the difference between the standard deviation of
observed flows and that of simulated flows being within
±15%; and (iv) the visual assessment of the flow duration
curve of the simulated monthly flows showed that
800
700
600
500
it
closely matched that of observed monthly flows.
The multiple regression method and neural network
method were used to determine if the calibrated model
parameters
400
300
200
could
be
predicted
using
river
basin
100
descriptors.
0
400
600
800
1000 1200
Rainfall (mm/yr)
1400
1600
1800
2000
Results
Table 11.15
presents a summary of the values of the basin
descriptors and flow statistics for the 52 river basins
selected for the study. The selected basins varied from very
small to medium-sized basins. The selected basins were
representative of low to high rainfall regions.
The flow duration curves were constructed using daily
flows that had been divided by the average daily flow.
Thus q90, q70, q50, q20 and q10 are dimensionless.
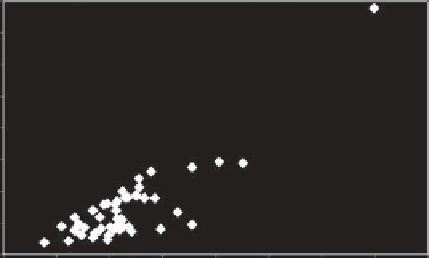
Figure 11.72. Mean annual runoff against mean annual rainfall.
The baseflow index could be predicted using: basin
slope (
Figure 11.73
), the proportion of the basin area with
grasslands, and the proportion of the basin having Kalahari
sands (r
2
0.69) (see
Chapter 8
).
The shape of a flow duration curve depends on the
relative contribution of baseflows to total flow. Perennial
rivers have flow duration curves with gentle slopes while
ephemeral (non-perennial) rivers characterised by frequent
low to no flows and very few large flows have steep flow
duration curves. For the 52 basins studied, the shape of the
flow duration curve could be predicted by an exponential-
type distribution which has two parameters that can be
predicted from the baseflow index (
Figure 11.74
) (see
Section 7.3.2
).
¼
Prediction of flow statistics from basin descriptors
Mean annual runoff for the 52 river basins appeared to be
linearly related to three parameters: the mean annual rain-
fall (
Figure 11.72
), proportion of the basin with gneissic
granites, and slope (r
2
0.81). There was no significant
improvement in the prediction of mean annual runoff using
neural networks (see
Section 7.2.3
for examples on neural
network methods).
¼


Search WWH ::

Custom Search