Geography Reference
In-Depth Information
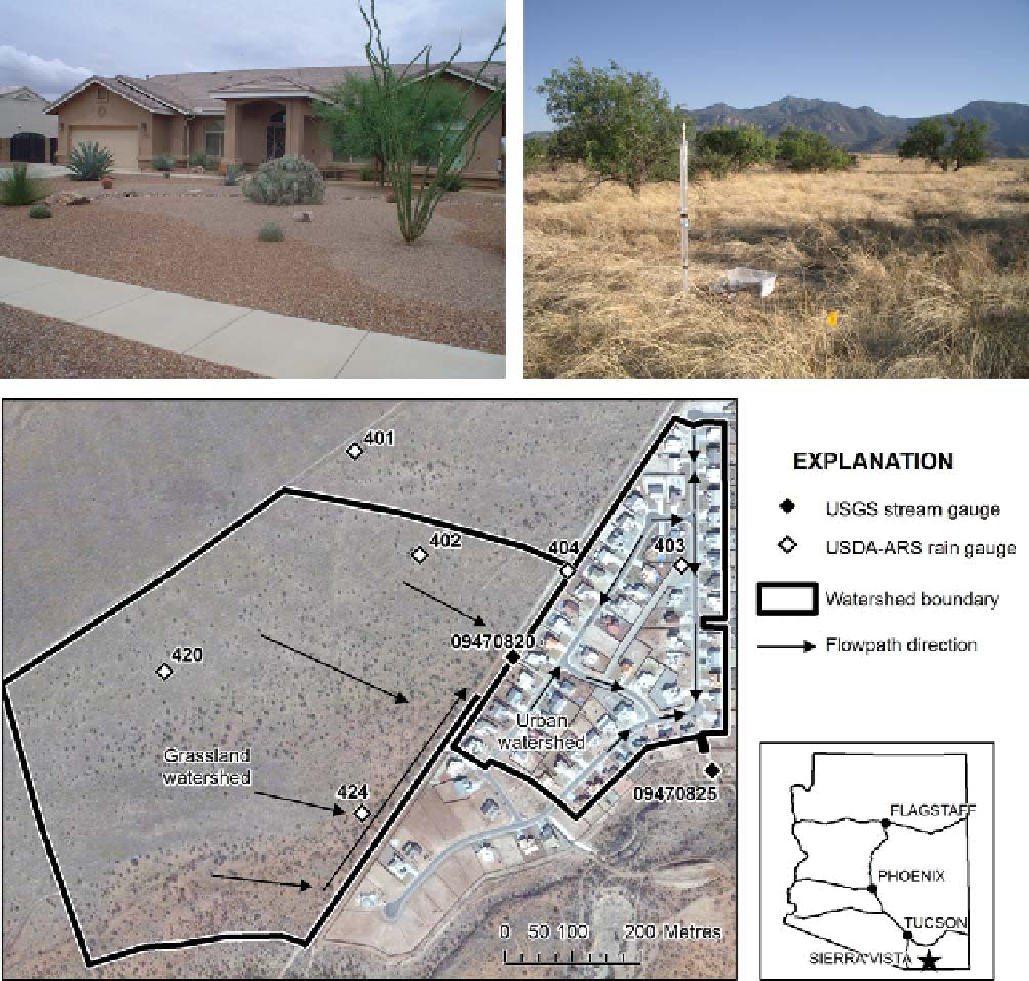
Figure 11.65. Study area photographs and map showing gauge locations, flow paths and catchment boundaries. The area in the upper right of the
urban catchment drains directly to the catchment outlet through a buried culvert; runoff from the remaining area is routed along streets.
rain gauge was equipped with a Hydra-Probe
1
soil mois-
ture sensor at 5 cm depth to provide initial soil moisture
data for the rainfall
Approximately 1.73 × 10
5
m
3
of cut material and 2.54 ×
10
5
m
3
of fill material were moved during the grading
process. Therefore, some additional amount of material
beyond that created from the cut process was likely
imported to the site. Tension infiltrometer measurements
were made at 69 sites throughout both catchments to
determine saturated hydraulic conductivity, on areas of
both cut and fill in the urbanised catchment, and on both
the upper, grass-dominated areas and the lower, mesquite-
dominated areas in the natural catchment. Further details of
runoff model. To characterise land
surface slope and catchment boundaries, a real-time kin-
ematic GPS survey was conducted in both catchments.
Survey data were used to construct a digital elevation
model for comparison with the pre-construction elevations.
-
1
Mention of this or other trade names does not imply endorsement by the
U.S. Government.
Search WWH ::

Custom Search