Geography Reference
In-Depth Information
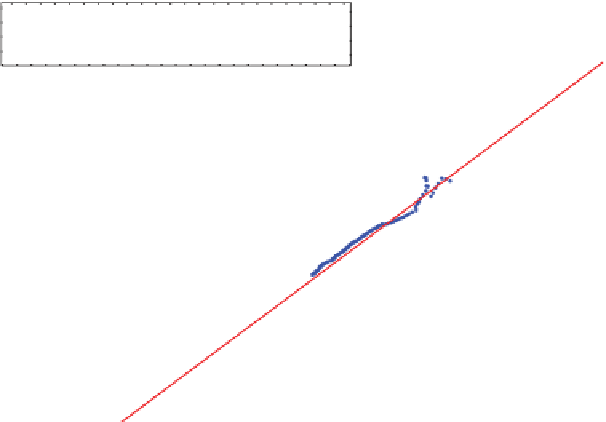
Figure 11.59. Rating relation
between simulated discharge (i.e.,
the average of 100 realisations) and
water levels with reference to h
0
at
Mfuwe.
10
4
Obs./Modelled
log(Q)=log(a)+b x log(h
−
h
0
)
10
3
10
2
10
1
10
0
10
2
10
3
10
4
h
obs
−
h
0
[mm]
3000
Q
sim
Q
obs
2500
2000
1500
1000
500
0
27/07/07
15/09/07
04/11/07
24/12/07
12/02/08
02/04/08
22/05/08
11/07/08
30/08/08
19/10/08
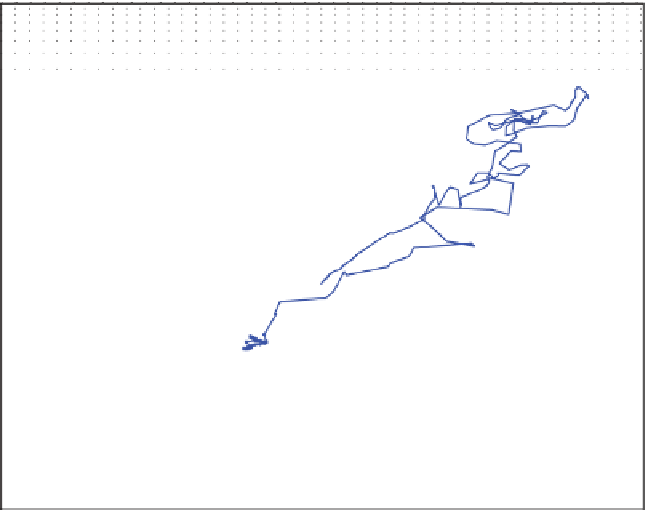
Figure 11.60. Validation of modelled discharge at Mfuwe. The gauged discharges are derived from in-situ measurements of water levels using
the rating curve.
information (e.g., signatures) from any available data
(even poor-quality, non-concomitant data), which in
combination provide a strong constraint on model
inference; and
(4) an objective framework should be applied, such as
presented in this chapter, to combine the pieces of
information for the purpose of model inference.
The model developed is currently working on-line, forced
by real-time SRE rainfall and Meteosat meteorological
information. It provides the water managers downstream
with real-time information on the expected inflows of the
Cahora Bassa reservoir and can be used to warn the popu-
lation against imminent floods. This PUB study has thus
made a valuable contribution to a societal problem.


Search WWH ::

Custom Search