Geography Reference
In-Depth Information
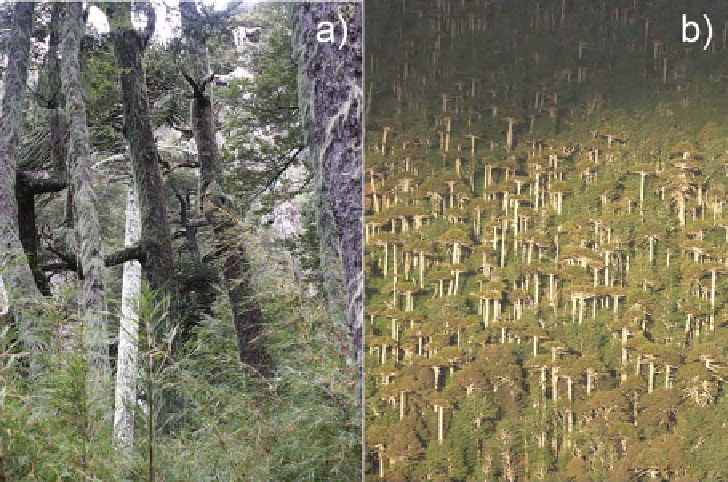
Figure 11.46. (a) Evergreen
Nothofagus forest and (b) Araucaria
forest (higher elevations).
Photos: T. Blume.
the site. Working in data-scarce areas demands a com-
bination of creativity with simple pragmatism, which in
this case resulted in two choices: (i) to focus the experi-
mental work on one typical hillslope, assuming that
understanding the processes here would help in under-
standing the hydrological functioning of the entire catch-
ment, and (ii) to use a multi-method approach, trying to
amass data from a number of different measurements and
experiments in order to piece together the hydrological
puzzle within a relatively short time frame and with a
relatively small budget (
Blume, 2008
;Blumeet al.,
2008a
,
b
).
As a counterpart to the experimental effort, both a
top-down and a bottom-up modelling approach were used.
The top-down approach used linear statistical models to
predict catchment event response, i.e., event runoff coeffi-
cients (see
Section 9.4
), hoping that the parameters that
proved to be significant for the prediction of runoff coeffi-
cients would also tell us something about the functioning
of the catchment (Blume et al.,
2007
). The bottom-up
approach used the physically based model CATFLOW
(Zehe et al.,
2001
) to predict runoff generation (surface
and subsurface) and was parameterised with parameters
either measured directly in the field or taken from the
literature (see
Section 10.4.1
). No calibration was carried
out, but the model was used as a sounding board or as a
platform for hypothesis testing. As only the assumed rep-
resentative hillslope was simulated, specific flows from the
hillslope were compared to specific discharge time series
of the entire catchment. This approach seemed viable, as
response times of runoff in this catchment are generally
very short and often less than 30 minutes.
Results
During several field campaigns a wide variety of different
data sets were collected: time series of groundwater, soil
water, runoff and climate parameters were measured over
the entire study, while some data were collected on an
event basis (e.g., water chemistry and stable isotopes) or
during experiments (dye tracers) (Blume et al.,
2008a
).
Furthermore, the structure of the subsurface was investi-
gated by manual augering and one-dimensional electrical
resistivity measurements and soil characteristics were
determined in situ and from soil cores in the laboratory
(Blume et al.,
2008b
). An example of how these various
data sources can be used to get an idea of the dominant
hydrological processes is shown in
Blume et al. (2009)
(see
Figure 11.47
).
A linear statistical model for the prediction of event
runoff coefficients was developed by investigating ten
different predictors describing catchment state, hydrograph
and event characteristics. The best linear statistical model
for the Malalcahuello Catchment was surprisingly simple
and included the predictors of pre-event discharge (a
descriptor of catchment state) and total precipitation. This
led to a prediction of event runoff coefficients with a NSE
of 0.9 and using a jack-knifing validation procedure still
produced an efficiency of 0.86 (
Figure 11.48
; Blume et al.,
2007
; see
Section 9.4
).
The fact that preferential flow was found in all 12 dye-
tracer experiments carried out under the forest (Blume
et al.,
2008a
,
2009
) led to the hypothesis that preferential
flow is essential for predicting runoff response in this
catchment (see
Chapter 4
). Running different parameter-
isations of a physically based model allowed us to test this
Search WWH ::

Custom Search