Geography Reference
In-Depth Information
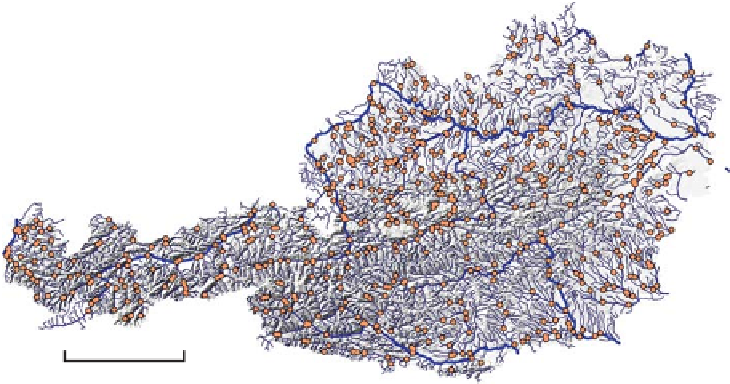
Figure 11.37. Topography, stream
network and stream gauges in
Austria used for the HORA project.
100 km
floods are caused by storm tracks from the Mediterranean
and occur in autumn. In the lower Alpine region at the
northern fringe of the Alps, rainfall is high because of the
orographic barrier of the Alps to north-westerly airflows.
In the northern lowlands, in contrast, rainfall is lower and
floods may occur in both summer and winter. The winter
floods are usually induced by rain-on-snow processes
when antecedent snowmelt saturates the soils and rela-
tively low rainfall intensities may then cause significant
flooding. In the far east of Austria, annual rainfall is low
and floods usually occur in summer as a result of frontal
events, sometimes combined with local convective events.
The south-east of Austria is hilly and conducive to con-
vective events.
For estimating floods in ungauged basins in Austria,
observed maximum annual flood peaks for 698 catchments
were available with record lengths ranging from 5 to 182
years (
Figure 11.37
). All the data were quality controlled
ally, mean annual precipitation data, a 10 m digital eleva-
tion model, hydrogeology, land use, information on
reservoirs and lakes and soil types were used. A digital
river network with the associated catchment boundaries
was also available for the 10 586 basins; 9888 of the basins
were ungauged.
information expansion: If the flood records were short (less
than about 20 years), they were compared with longer
records of neighbouring catchments in order to account
for climate fluctuations. While formal climate adjustment
methods exist (e.g., IH,
1999
, Volume 3, p. 212; or
Section
9.3.4
in this topic), analysis of the data indicated that much
of the information is qualitative, and therefore expert
judgement was used for any adjustments of the flood
moments. Similarly, the flood records were compared with
historic flood information (such as historic photographs)
where available in order to assess the relative magnitudes
of the largest floods in a region (see
Section 9.4.3
). (ii)
Spatial information expansion: Flood data from neigh-
bouring catchments were also used to improve the at-site
flood frequency estimation. For catchments up to a catch-
ment area of about 10 000 km², maps with the 100-year
flood regionalised by the top-kriging method discussed
below were used to put the local flood estimates into
context. For larger catchments the floods were plotted
against stream length as longitudinal profiles to assess
any inundation effects. (iii) Causal information expansion:
Finally, the flood estimates for the stream gauges were
compared with process information such as the rainfall
records, runoff coefficients, hydrograph shapes and proxy
data (see
Section 9.4.3
) and, if needed, any adjustments
were performed.
Method
Local flood data
As a starting point, the pre-processed flood peak samples
of all the 698 stream gauges were used to estimate the first
three statistical moments: mean annual flood (MAF), coef-
ficient of variation (C
V
) and coefficient of skewness (C
S
).
These local flood data were complemented by three types
of information (Merz and Blöschl,
2008a
,
b
): (i) Temporal
Regionalisation method
The Vienna University of Technology had recently
developed the top-kriging method (Skøien et al.,
2006
),
which is the basis of the flood regionalisation to
ungauged basins for implementing the EU Flood Direct-
ive in Austria. Top-kriging (see
Section 9.3.3
)isbased
on the spatial correlations of the flood moments and
takes both catchment area and distance along the stream
Search WWH ::

Custom Search