Geography Reference
In-Depth Information
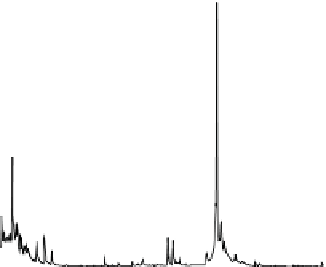
Figure 11.26. Distribution of
goodness-of-fit statistics: (left)
Nash
-
Sutcliffe efficiency values and
(right) root mean square error,
computed from observed and
estimated mean, daily runoff values
at the 18 validation stream gauges.
From Archfield et al.(
2010
).
Explanation
1.0
300
Upper limit
(75th percentile + 1.5 *(75th percentile - 25th percentile))
250
0.8
75th percentile
200
0.6
Median
150
0.4
100
25th percentile
0.2
50
Lower limit
(25th percentile + 1.5 *(75th percentile - 25th percentile))
Values above the upper limit or below the lower limit
0
0
0
1187300, Hubbard River near West Harland, CT (HUBB)
0
1188000, Burlington Brook near Burlington, CT (BURL)
1400
350
Nash-Sutcliffe efficiency value = 0.98
(A)
(C)
Nash-Sutcliffe efficiency value = 0.69
LINEAR SPACE
LINEAR SPACE
Estimated streamflows
Observed streamflows
1200
Estimated streamflows
Observed streamflows
300
1000
250
800
200
600
150
400
100
200
50
0
0
10/1/1960 12/30/1960 3/30/1961 6/28/1961 9/26/1961 12/25/1961 3/25/1962 6/23/1962 9/21/1962
10/1/1960 12/30/1960 3/30/1961 6/28/1961 9/26/1961 12/25/1961 3/25/1962 6/23/1962 9/21/1962
1000
10000
(D)
Nash-Sutcliffe efficiency value = 0.69
(B)
LOG SPACE
LOG SPACE
Nash-Sutcliffe efficiency value = 0.98
Estimated streamflows
Observed streamflows
Estimated streamflows
Observed streamflows
1000
100
100
10
10
1
1
0.1
0.1
10/1/1960 12/30/1960 3/30/1961 6/28/1961 9/26/1961 12/25/1961 3/25/1962 6/23/1962 9/21/1962
10/1/1960 12/30/1960 3/30/1961 6/28/1961 9/26/1961 12/25/1961 3/25/1962 6/23/1962 9/21/1962
Figure 11.27. Observed and estimated runoff for US Geological Survey stream gauges (A and B) Hubbard River near West Harland, CT
(HUBB), and (C and D) Burlington Brook near Burlington, CT (BURL), showing the best (A and B) and worst (C and D) agreement
between unregulated observed and estimated mean daily runoff in linear space and log space; southern New England study area, 1960
-
2.
From Archfield et al.(
2010
).
to select a reference stream gauge for information trans-
fer to an ungauged location and was published as a
journal article. The methods used to estimate daily runoff
at ungauged locations in Massachusetts were published
as a US Geological Survey report (Archfield et al.,
2010
)
so this critical information could be made publicly avail-
able to the stakeholders and water managers who had the
greatest need. Lastly, the methods developed for this
study were coded into a publicly available decision-
support tool for use by the water resources community,
which is available to download from the US Geological
Survey.
The decision-support tool is now being used to deter-
mine water allocation permits, assess the effects of
various ecological flow targets on water availability, and
identify sustainable water withdrawal scenarios for
ungauged basins in Massachusetts. In addition to facili-
tating compromise between stakeholder groups and


Search WWH ::

Custom Search