Geography Reference
In-Depth Information
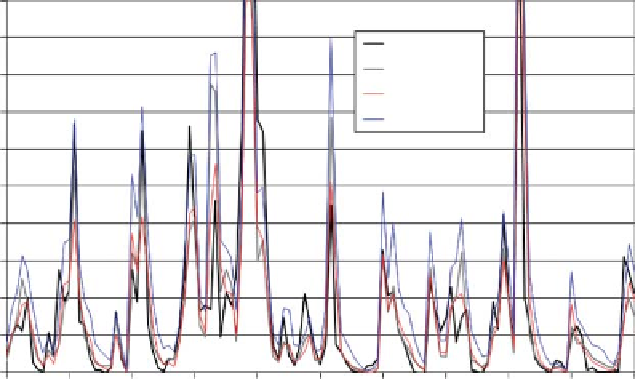
Figure 11.23. A 10-year sample of
the time series of observed and
simulated monthly flow volumes at
D2H001 (sub-basin D23F).
500
450
D2H001
Midgley et al.
Sim Lower
Sim. Upper
400
350
300
250
200
150
100
50
0
1940
1941
1942
1943
1944
1945
Years
1946
1947
1948
1949
1950
pattern of observed daily flows through the dry season
(more daily variations than would normally be expected)
suggests that this reservoir was used for controlled releases
down the tributary channel to the Caledon River (
Figure
11.22b
). Coupled with the very short period of record,
these observations are not useful for assessing the simula-
tion bounds.
The records at D2H005 (1942 to 1956) are similarly
very short but are less affected by the limitations of the
rating curve than at D2H012. The indications are that
natural low flows are sustained to a greater extent than
suggested by the model and this may be associated with an
under-estimation of the interflow parameters of the model
for the sub-basins draining the mountains of Lesotho
(D21A, C, D, J, K and L
by Midgley et al.(
1994
) with an earlier version of the
model and climate inputs that are identical to those used in
this study (
Figure 11.22f
). Given that the observed high
flows are quite uncertain and that some water abstractions
were occurring even before the 1960s, the conclusions are
that the ensembles generated by this study appear to be
behavioural.
Figure 11.22f
indicates that this study has
predicted a lower band of uncertainty for low flows than
the Midgley et al.(
1994
) simulations, although this is not
immediately evident in
Figure 11.23
, which represents a
sample of the time series.
Discussion
The Caledon River basin is generally representative of the
situation in many parts of South Africa, where the
observed runoff data associated with gauging stations are
of limited value for calibrating hydrological models to
simulate natural conditions. However, as this study sug-
gests, at least some of the observed data can be useful for
assessing uncertainty ensemble outputs from models. Des-
pite apparently behavioural uncertainty bounds at the basin
outlet, there is an indication that the low flows for the steep
topography (Lesotho) north-eastern parts of the basin have
been under-simulated. These sub-basins are not covered by
the AGIS (
2007
) soils database and their parameter distri-
butions have been extrapolated from the headwater sub-
basins that are within South Africa (upstream of D2H012).
The results suggest that the estimated parameter values
affecting the low flow response in these parts of the basin
should be revisited. However, there is little available infor-
mation upon which to base this revision. It is also note-
worthy that
Figure 11.20
). Without further
information about maximum flood flows it is difficult to
comment about the high flow simulations (
Figure 11.22c
).
The gauge at D2H020 is currently operational and the
records start in 1983, but there are missing data between
1991 and 2006. This gauge is located within the city area
of Maseru but there is no documented explanation for the
excessively long periods of zero flow compared to other
sites on the main Caledon River (
Figure 11.22d
).
The final gauge before Welbedacht dam is located at
D2H001 (13 421 km
2
) and the records provide a relatively
continuous data set from 1934 to 1961. While the main
gauging station does not provide flood peak values, add-
itional data for a rated flood section at the same site
provide information that can be used to approximately fill
the high flow data gaps, albeit with a high degree of
uncertainty. The simulated ensemble band is compared
with both the gauged records (infilled with estimated high
flows
-
-
Figure 11.22e
) as well as the simulations generated
the uncertainties in the climate input data
Search WWH ::

Custom Search