Geography Reference
In-Depth Information
1.0
0.9
0.8
0.7
0.6
0.5
0.4
0.3
0.2
0.1
0.0
0.00
250
A. Ghataprabha
B. Palleru
200
B
A
150
100
Deccan Plateau
Western Ghats
w=1.2
50
w=0.25
0
123456789 0 1 2
0.50
1.00
1.50
2.00
2.50
3.00
E
p/
P
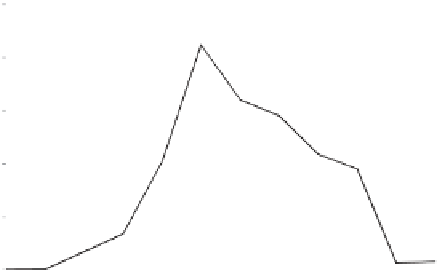
Figure 11.5. Monthly precipitation in the two catchments selected for
modelling, one in the Western Ghats (A: Ghataprabha) and one in the
Eastern Ghats (B: Palleru). The x-axis indicates the month, with
January as month 1.
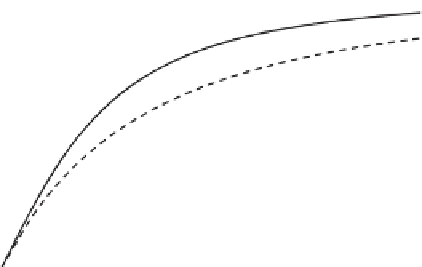
Figure 11.4. Budyko plot of catchments in the Krishna Basin.
Black circles indicate catchments draining the Western Ghats, and
open circles indicate catchments draining the Deccan Plateau.
A and B indicate the catchments chosen for the modelling (see
Figure 11.3
for their locations). The values of w are the catchment
soil parameter from Zhang et al.(
2001
).
E
p
, and land surface condition, including soil water hold-
ing capacity, on annual runoff (e.g., Farmer et al.,
2003
;
see
Chapter 5
). Here we test for the importance of the
monthly distribution of P and E
p
using the monthly water
balance on two catchments (Model 1). The impact of
spatial distribution of P and E
p
is tested using an annual,
spatially distributed water budget (Model 2).
Precipitation is distributed differently in the two selected
catchments, both temporally and spatially. Catchment A in
the Western Ghats, the Ghataprabha catchment, has
extreme spatial variability in rainfall: it receives more than
2000 mm/yr of rainfall in just 5% of its area, and 20% of its
area receives less than 500 mm/yr. Catchment A also
receives more of its rainfall in the early part of the mon-
soon, which is consistent with the earlier arrival of the
south-west monsoon compared to the north-east monsoon.
Catchment B in the Eastern Ghats, the Palleru catchment,
has a much more spatially homogeneous precipitation field,
and has no area where precipitation is more than 2000 mm/
yr and only 1% less than 500 mm/yr. Catchment B receives
more of its precipitation from the north-east monsoon in
August through October (
Figure 11.5
).
The lumped, monthly model predicts the E/P of the
catchment on the Deccan Plateau reasonably well (0.73
predicted versus 0.78 observed), but it incorrectly predicts
that the catchment in the Western Ghats (A: Ghataprabha)
has a higher E/P than the catchment in the Deccan Plateau
(B: Palleru) (
Table 11.3
). The spatially distributed but
temporally lumped model (2 in the methods) provided a
more accurate prediction of E/P for the catchment on the
Deccan Plateau than the lumped monthly water balance
(0.80 versus 0.78 observed), but performed worse for the
catchment draining the Western Ghats and did not accur-
ately predict differences in the E/P ratios between the two
catchments.
representative the period of discharge was of the long-term
mean (1968
2009) in the basin. The percentage deviation
was small, with a lower bound of
-
3.9% and an upper
bound of +4.2%, suggesting that the discharge and TRMM
time periods had mean precipitation that was similar to the
long-term, climatic average.
−
Results
Question 1: Can a simple climatic index, calculated from
satellite imagery and interpolated meteorological data, pre-
dict long-term runoff ratios over peninsular India?
The observed E/P ratios follow the pattern expected
from the Budyko curve (
Figure 11.4
), but with two distinct
runoff regimes. Basins draining the Deccan Plateau, which
includes all catchments that do not drain the Western
Ghats, have higher E/P and lower runoff ratios for a given
climate compared with basins with some portion of their
drainage area in the humid region of the Western Ghats.
Catchments on the Deccan Plateau fit a Budyko curve with
a soil capacity parameter of w
¼
1.2 (Zhang et al.,
2001
).
The
Western Ghats catchments showed a different Budyko
relationship, which was approximately linear and had
lower E/P values than catchments on the Deccan Plateau
with the same climate. The catchments draining the West-
ern Ghats did not follow any established Budyko curve.
Question 2: How much detail in the temporal and spatial
distribution of climate is required to accurately predict
regional patterns in long-term runoff?
Other top-down studies have emphasised the importance
of both climatic variability, especially the timing of P and


Search WWH ::

Custom Search