Geography Reference
In-Depth Information
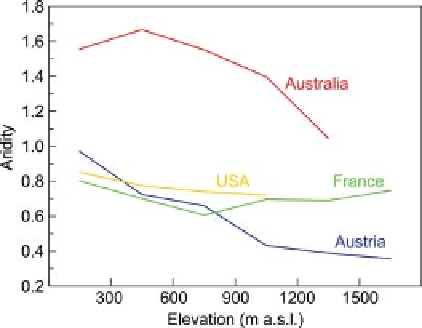
Figure 10.39. Aridity as a function of mean catchment elevation for
the studies used in Level 2 (
Table A10.2
). The aridity represents
the median over all catchments in a particular elevation class.
After Parajka et al.(
2013
).
scale may be due to two reasons. The first is a trend for an
increasing number of rain gauges within a catchment as the
catchment size increases. The second may be related to the
aggregation effect of runoff. As the catchment size
increases some of the hydrological variability is averaged
out due to an interplay of space-time scale processes that
will improve hydrological simulation. Both effects are
consistent with the scale effects of performance in gauged
catchments (see e.g., Merz et al.,
2009
; Nester et al.,
2011
).
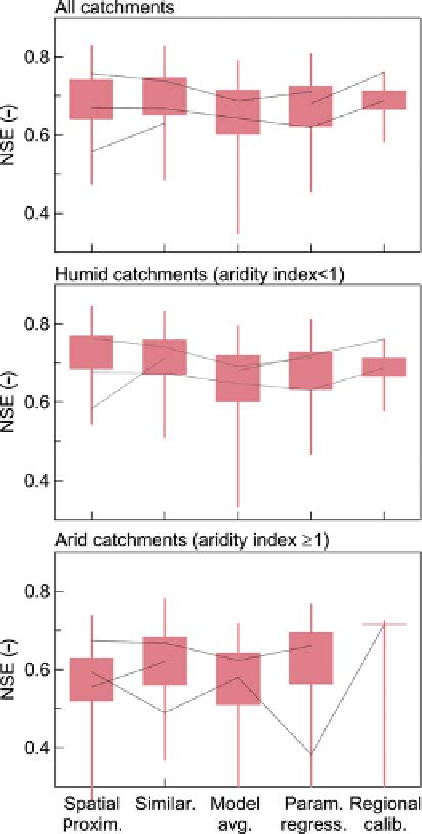
Which method performs best?
Figure 10.40
summarises the performance for different
regionalisation approaches, stratified by the aridity index.
The top, middle and bottom panels show the performance
for all catchments in
Table A10.2
and catchments with an
aridity index below and above 1, respectively. Overall,
in all catchments the spatial proximity and similarity
methods perform slightly better than the parameter regres-
sion and model averaging approaches. In arid catchments,
however, similarity and parameter regression tend to per-
form slightly better than spatial proximity and model
averaging. These results suggest that climate characteris-
tics more strongly impact on the runoff prediction per-
formance in ungauged basins than the regionalisation
method.
Figure 10.40. Nash-Sutcliffe efficiency (NSE) of predicting
hydrographs in ungauged basins for different regionalisation
methods, stratified by aridity. Lines connect median efficiencies
for the same study. Boxes are 40%
-
60% quantiles, whiskers are
20%
-
80% quantiles. After Parajka et al.(
2013
).
-
The performance of all methods increases with catch-
ment area.
-
In humid conditions spatial proximity and similarity
methods perform best, while in arid catchments simi-
larity and parameter regression perform slightly better
than the other methods.
Main findings of Level 2 assessment
-
The performance of all methods decreases with
increasing aridity.
10.6 Summary of key points
-
The dependence of performance on elevation and
air temperature differs by region and depends
on how aridity varies with elevation and air
temperature.
The runoff hydrograph represents the temporal pattern
of runoff, in particular the full time sequencing of runoff
over many years, and is therefore the composite of all
Search WWH ::

Custom Search