Geography Reference
In-Depth Information
Figure 10.11. Hydrological landscape regions in the USA ranging
from flat land (group 1, red) to mountainous (group 20, blue).
From Wolock et al.(
2004
).
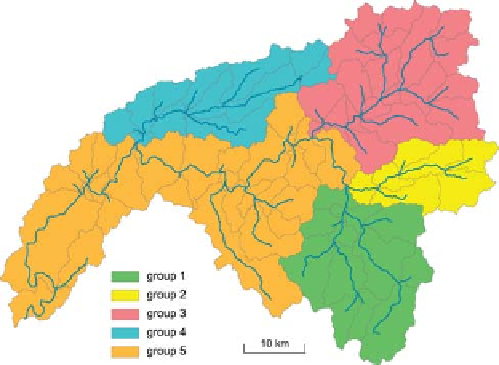
Figure 10.12. Subcatchments within the Illinois River basin grouped
on the basis of clay ratio, topographic slope, regional geology and
dominant runoff generation mechanisms. Increasing group numbers
are accompanied by decreasing clay content of soils (hence
increasing saturated hydraulic conductivity) and increasing
topographic slope. This leads to decreasing saturation excess runoff
and increasing subsurface stormflow, as a fraction of total runoff.
(the sensitivity of runoff to the variability of precipitation),
baseflow index, and the number of snow days. Cluster
analysis was then used to identify nine classes: Catchments
in the north-eastern USA (pink cluster) are characterised
by high runoff coefficients and large amounts of snow;
catchments slightly further to the south (in Pennsylvania
and Virginia, purple cluster) by lower runoff ratios and less
dominant snow storage, long storm durations and rela-
tively poorly drained soils; further to the south (grey clus-
ter) by less snow, less seasonal precipitation, a higher
percentage of sandy soils and low relief. The number of
snow days decreases even further in the blue-green cluster
and catchment storage is high resulting in higher baseflow.
In the west of this cluster group, in the southern Missis-
sippi River basin (green cluster) there is somewhat lower
baseflow. The catchments located furthest west (orange
cluster) are more arid, experience the lowest precipitation
and lowest runoff ratios. Catchments south of Iowa (yellow
cluster) have the lowest baseflows, which is related to very
poorly drained soils. Numerous other examples of catch-
ment grouping based on runoff classification are reviewed
in
Olden et al. (2012)
and Kennard et al.(
2010
).
flatlands (red in
Figure 10.11
) to mountainous (blue in
Figure 10.11
). Group 1, for example has very flat terrain
and very permeable soils and bedrock and a surplus of
precipitation over potential evaporation, so both shallow
and deep groundwater are likely to occur. Group 6 has
impermeable soils and bedrock and a sub-humid climate,
so overland flow is likely to occur. Group 20, in contrast, is
mountainous, has permeable soils, impermeable bedrock
and a humid climate, so shallow groundwater flow is likely
to occur. There are differences between this grouping and
the runoff grouping in
Figure 10.10
.In
Figure 10.11
,
geology and topography seem to be strongly reflected in
the grouping, while in
Figure 10.10
climate may be more
importan
t.
Landscape units can also be grouped into HRUs on the
basis of slope aspect, vegetation type and soil type. These
can then be used as a basis for inferring model parameters
from landscape characteristics for distributed hydrological
models. The way the layers of information are combined
can have various degrees of process representation. Flügel
(
1995
) combined the layers by reasoning for a unit to
represent, for example,
Grouping based on climate and catchment characteristics
Catchments can also be grouped on the basis of climate
and catchment characteristics. Wolock et al.(
2004
) used
the hydrological landscapes concept of Winter (
2001
)to
group catchments into hydrological landscape regions
according to their similarity of landform (e.g., relief, per-
centage of flatland), geological texture (permeability of
soil estimated from percentage of sand; bedrock permea-
bility from lithological groups) and climate characteristics
(mean annual precipitation minus potential evaporation).
They combined principal component analysis and cluster
analysis to obtain 20 groups. The groups range from
rangeland on gley soil at the valley
floor with shallow groundwater over impervious bedrock
'
.
Figure 10.12
presents an example of catchment grouping
in a large catchment in Oklahoma, USA, on the basis of
clay ratio of soils, regional geology and topographic slope,
and their combined effect on dominant runoff generation
mechanisms. Increasing group numbers indicate decreas-
ing clay content of
'
soils
(thus
increasing saturated

Search WWH ::

Custom Search