Geography Reference
In-Depth Information
0.5
100
0.4
1000
600
500
0.4
10
0.3
400
100
0.3
300
1
0.2
0.2
10
200
0.1
0.1
0.1
100
0
0.0
0.01
0.0
1
0.0
0.25
0.5
0.75
1.0
J
MM
JS
N
0.0
0.25
0.5
0.75
1.0
12 5 0
20
0
1
2
5
10
20
50
Exceedance frequency
Exceedance frequency
Return period (yrs)
1
0.1
0.01
0.001
1985
1986
1987
1988
1989
1990
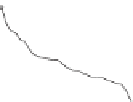
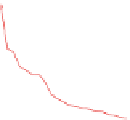
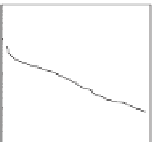
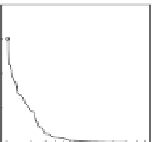
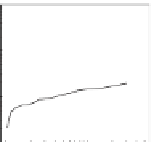
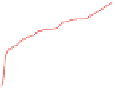
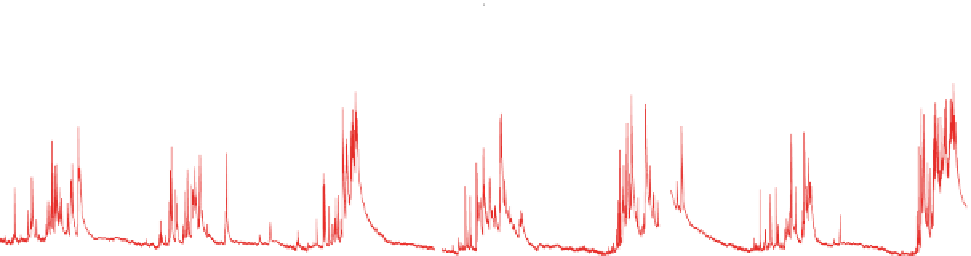
Figure 10.7. Signatures of runoff variability for two catchments: Harvey River catchment (148 km²), near Perth (black lines); and
Seventeen Mile Creek catchment (619 km²), near Darwin (red lines). (Top, from left to right) Distribution of annual runoff, seasonal runoff
regime, flow duration curve, distribution of annual q
95
low flows, and distribution of annual floods. (Bottom) Hydrographs of the two
catchments. Courtesy Jos Samuel.
especially Darwin. On the other hand, the hydrographs
indicate that Darwin experiences more episodic runoff
responses with higher runoff peaks, due to the high rainfall
intensities experienced. This is also reflected in the flow
duration curves, and in the much higher flood peaks in the
flood frequency curves. On the other hand, low flows in
Darwin are much higher than in Perth, and fairly invariant
between years (note much lower inter-annual variability of
flow duration curves at the low flow end). This is due to
the presence of a shallow regional groundwater aquifer,
which maintains low flows at a relatively high rate in
all years.
However, these signatures do not fully capture every
aspect of variability represented in a runoff hydrograph.
In arid basins, for example, the sequencing of runoff events
(e.g., average period between events) and the non-linear
relationship between event runoff and precipitation (e.g.,
expressed by runoff coefficient functions) can be more
powerful indicators of hydrological similarity. Similarly,
in terms of process realism, total runoff can be decom-
posed into its various components (e.g., infiltration excess,
saturation excess, subsurface stormflow), and runoff simi-
larity can be extended to cover the relative dominance of
these processes, and patterns of their temporal and spatial
variations. These can be ascertained in gauged basins on
the basis of baseflow separation procedures, assisted by
environmental tracers (see
Chapter 4
), and through the use
of physics-based models, conditioned on measured runoff
hydrographs.
Climate similarity
Climate similarity, in the context of runoff hydrographs,
can be expressed at many scales, as discussed in several
previous chapters. At the annual scale, similarity is
governed by the competition between water available
(e.g., annual precipitation, P) and energy available for
evaporation, normally expressed in terms of annual poten-
tial evaporation, E
p
(Budyko,
1974
;L
vovich,
1979
). In
this case, climate similarity can then be expressed in terms
of the aridity index, E
p
/P. In the case of seasonal flow, the
relative timing of P and E
p
is a key similarity measure (i.e.,
in phase or out of phase). In cold regions, the seasonal
energy or temperature variation, in relation to precipitation
variability, is an additional similarity measure, since it
determines the occurrence and timing of precipitation as
snow and snowmelt. The climatic regime, including radi-
ation energy (or E
p
) and temperature as well as precipita-
tion, also controls the nature of vegetation cover dynamics,
e.g., phenology (Czikowsky and Fitzjarrald,
2009
), aspects
of which cannot be simply expressed in terms of quantita-
tive measures, and are typically presented through ecosys-
tem classifications at regional scales.
Additional features of the climate inputs relevant to
runoff hydrographs include the sequencing of precipitation
events (which may be expressed in terms of precipitation
duration curves, see
Chapter 7
), characteristic spatial dis-
tribution patterns (e.g., orographic effects, patchiness) and
storm movement. Patchy and episodic precipitation in arid
regions give rise to episodic, localised runoff events and
'


Search WWH ::

Custom Search