Geography Reference
In-Depth Information
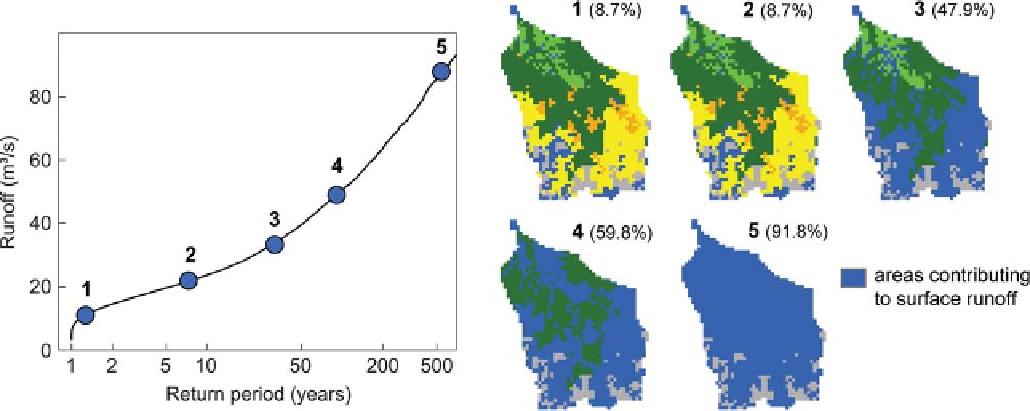
Figure 9.5. Runoff generation in the Weerbach catchment, Alpine Austria. (Right) Areas contributing to fast surface runoff for events of
different magnitudes (1, low magnitude to 5, high magnitude). The percentage contributing area is given in parentheses. Blue indicates areas
contributing to surface runoff; colours relate to different hydrological response units. (Left) The simulated flood frequency curve with these
events indicated shows non-linearity due to a change of processes. From Rogger et al.(
2012a
).
increases the contributing areas expand, causing the
marked non-linearity in the flood frequency curve. At
event magnitudes larger than those shown, the flood fre-
quency curves flatten off. In this example, there is a
threshold that controls the shape in the flood frequency
curve related to the storage capacity of the catchment. In
other hydrological settings, different threshold processes
may occur (e.g., Zehe and Sivapalan,
2009
; Struthers and
Sivapalan,
2007
) that may produce similar non-linearities
or step changes in the flood frequency curve, particularly if
the catchments are small.
pathways water takes to reach the outlet. A key factor
determining the magnitude of the flood peak is the rela-
tive time scale of the storm duration and, at the same time,
the mean response time of the catchment. This interplay
can give rise to resonance (Robinson and Sivapalan,
1997a
,
b
; Blöschl and Sivapalan,
1997
). The largest floods
are often produced by storms with durations similar to the
response time of the catchment (Viglione and Blöschl,
2009c
), which is the basis of many methods of design
flood estimation, such as the rational method (see
Section
9.4
). This leads to a scale effect: in catchments where the
response times are short, the largest floods are produced
by short duration storms. Conversely, in catchments with
long response times the largest floods are produced by
long duration storms. Even though this is generally the
case, other factors can modulate this behaviour, such as
multiple storms and the seasonality of soil wetness, which
can produce quite different flow paths and therefore
response times in different parts of the year (Sivapalan,
2005
).
Runoff routing
Runoff that is generated locally flows off the surface or
through the subsurface of the hillslopes to the streams.
These runoff routing processes reflect the temporary
storage of storm runoff in its passage to any specified
point in the river network (including the catchment
outlet), and the competition between the rate of runoff
generation and the rate of runoff release from the catch-
ment. They determine the shape of the flood hydrograph
and therefore the flood peak. Runoff routing is affected
by two main factors: (i) the size and shape of the catch-
ment and the topology of the river network. These deter-
mine the distribution of distances that the water has to
travel to reach the outlet; (ii) roughness and slope of land
surface, the soil hydraulic properties, hydrogeology and
properties of the river channel cross-section (i.e.
hydraulic geometry) across the river network. These
together determine the flow velocities in the various
Change: human impacts
There are few streams around the world that do not have
some sort of human-induced modification. Land use modi-
fications (e.g., deforestation, construction of roads, build-
ings and other infrastructure) affect runoff generation and
routing throughout the catchment. Commonly cited conse-
quences of urban development include reduced catchment
response times combined with increased runoff volumes,
resulting from introduction of impervious surfaces and
Search WWH ::

Custom Search