Geography Reference
In-Depth Information
1.0
1.0
0.8
0.8
0.6
0.6
0.4
0.4
0.2
0.2
Arid
Cold
Humid
Process
based
Geo-
statist.
Global
regress.
Regional
regress.
Short
records
Climate region
Regionalisation method
Figure 8.16. Coefficient of determination (R²) of predicting low
flows in ungauged basins stratified by climate. Each circle refers to a
result from the studies in
Table A8.1
. Boxes show 25%
-
75%
quantiles. After Salinas et al.(
2013
).
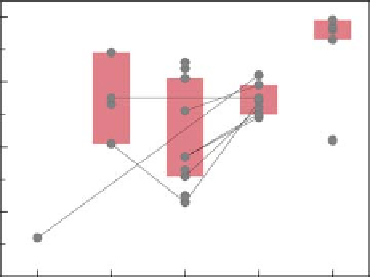
Figure 8.17. Coefficient of determination (R²) of predicting low
flows in ungauged basins stratified by regionalisation method.
Each circle refers to a result from the studies in
Table A8.1
. Lines
indicate studies that compared different methods for the same set
of catchments. Boxes show 25%
-
75% quantiles. After Salinas et al.
(
2013
).
same regionalisation approach, but the methodology is
similar. There are also differences in the low flow indices
used. They include Q
95
, Q
7,10
, Q
mon,5
, all standardised by
catchment area or mean flow, and the dimensionless base-
flow index (BFI). In particular Q
95
low flows are usually
closely correlated to Q
7,10
so that a comparison across the
various indices should provide consistent results at the
level of detail used for the comparisons.
Figure 8.17
shows
a large performance range across the regionalisation
methods. Overall, it is clear that low flow predictions from
short records (R²
uncertainty. It is therefore useful to apply each different
method to the same catchment. A number of studies avail-
able in the literature have performed such a comparison
and the results are indicated as grey lines in
Figure 8.17
.
Most
of the studies compare global and regional regres-
sions. The comparisons clearly show that the regional
regressions always perform better than the global regres-
sions. The studies that conduct this comparison show that
the average performance of global regressions is around
0.5 and this increases to 0.7 for regional regressions. It
should be noted that the performance reported is cross-
validation performance for ungauged basins, so better per-
formance is related to better predictions rather than
improved goodness of fit of the regressions. There are also
a few studies that compared geostatistical methods with
regional regression methods. In one study from France
(Plasse and Sauquet,
2010
), the geostatistical method was
based on distance between the catchment centres of grav-
ity. The performance was better than for global regression
and worse than that of regional regression. If the stream
network structure is taken into account, the performance of
geostatistical methods can in fact be higher than that of
regional regression as illustrated in the Austrian case stud-
ies (Laaha et al.,
2007
,
2013
). Finally, one study (Engeland
and Hisdal,
2009
) compared process-based methods with
regional regressions and found that the regressions gave
better results. Clearly, application of process-based
methods does not per se include the performance of low
flow estimation but their value depends on the amount of
information available for careful parameterisation of the
model. However, process-based methods have more
0.62 to 0.99) perform best. The method
performs significantly better than all other methods, pro-
vided continuous runoff measurements from at least 3
¼
5
years of observations at the site of interest are used.
A lower performance (0.62) is obtained when using a
single flow measurement during the low flow period. The
performance of global regression ranges from 0.43 to 0.86.
Studies from high-mountain environments have a lower
performance (Austria: 0.57, Switzerland: 0.51, Nepal:
0.53, India: 0.45), perhaps because the heterogeneity of
the low flow process in the landscape (including snow)
poses difficulties for applying one single regionalisation
model for the entire domain, so division into sub-regions
may be necessary. Global regression is better suited to
smaller regions (e.g., German region Baden-Württemberg)
and studies in less seasonal climates (e.g., New South
Wales and Victoria in Australia). The four results from
geostatistical models give performances between 0.61 and
0.89. A continuous runoff model, tested in only one study
used in the meta-analysis, gave lower performance than the
statistical methods.
The studies examined differ in terms of the hydrological
characteristics and data availability, so a comparison of
methods
-
for
different
regions will
involve
some

Search WWH ::

Custom Search