Geography Reference
In-Depth Information
data from 1419 catchments, four groups of regionalisation
methods and four catchment characteristics. The regional-
isation methods are regression approaches, index methods,
geostatistics and process-based methods. The catchment
characteristics are aridity (potential evaporation by mean
annual precipitation), mean annual air temperature, mean
elevation and catchment area.
The performance assessment was based on the slope of
the middle part of the FDC defined as the difference
between the 30% and 70% normalised runoff quantiles
divided by 40. This slope quantifies the relative change
of runoff for 1% difference in exceedance probability. It
was chosen for this analysis because it is a specific feature
of the FDC, while the upper and lower parts of the FDC are
related to floods and low flows treated in
Chapters 8
and
9
.
Furthermore, it is related to the variance of daily runoff and
to climate and catchment processes as discussed in
Section 7.2
. The performance was then calculated as the
normalis
ed error (NE) and absolute normalised (ANE)
(
Table 2.2
) of the slope. The NE highlights biases in the
methods while the ANE is a measure of the overall per-
formance. Note that the ANE is an error measure, so it has
been plotted downwards on the vertical axis to make it
comparable with the performance measures, i.e. higher up
in the plot is better. For comparison with the other runoff
signatures in
Chapter 12
, R² of the slope of the FDC were
calculated for all methods in each study separately, which
gave a median of 0.26. Also, the NSE of the quantiles of
the scaled FDC were calculated, which gave a median of
0.98. Other evaluation measures may lie in between. As an
indicative range of typical performances, a range of 0.40 to
0.95 is shown in
Chapter 12
.
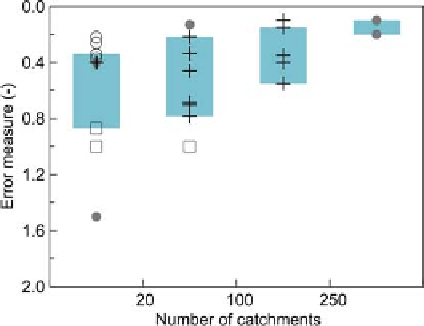
Figure 7.21. Absolute normalised error in the middle of the FDC
(full circles), the proportion of sites with Nash
-
Sutcliffe efficiency
calculated over quantiles lower than 0.75 (pluses), the proportion of
sites with absolute normalised error lower than 1 (empty squares),
and the mean relative root mean square error (empty circles) of
predicting FDCs in ungauged basins stratified by the number of
catchments within each study. Each symbol refers to a result from the
studies indicated in
Table A7.1
. Boxes show 25%
-
75% quantiles.
estimating a FDC for a single catchment it may be
worth basing the regionalisation on a large number of
catchments.
Main findings of Level 1 assessment
-
The prediction performance of flow duration curves in
ungauged basins tends to be better in humid climates
than in arid climates.
-
Methods that use short runoff records at the site of
interest perform better than any regionalisation
method provided at least 1 year of daily runoff data
are available, and significantly better if 2
To what extent does runoff prediction performance depend
on climate and catchment characteristics?
The assessment of the predictive performance of the dif-
ferent methods with respect to the four climate and catch-
ment characteristics is presented in
Figures 7.22
and
7.23.
The top panels of both figures show the dependence of
performance on aridity. For the regression method per-
formance clearly decreases with aridity. For the most arid
catchments (aridity indices between 1 and 2), the regres-
sion approach tends to overestimate the slope of the FDC
(
Figure 7.23
). For all the other methods, the decrease in
performance with aridity is less clear, perhaps with the
exception of the process-based methods. It should be noted
that the methods were applied to different regions: regres-
sion to France and the USA, and the other methods to
Austria and northern Italy where the catchments are never
very arid. While generally one would expect a decrease of
performance with increasing aridity, since arid regions
tend to be more heterogeneous than humid ones, there
may also be differences in the results for the different
-
5 years of
data are available.
-
The performance increases clearly with number of
stream gauges in the region.
7.5.2 Level 2 assessment
The Level 1 synthesis of existing studies (
Table A7.1
)
cl
early showed that many studies only report summary
statistics of regionalisation performance and/or catchment
characteristics, which hampers detailed attribution of the
performance and comparison of results between studies.
The objective of the Level 2 synthesis is to examine and
explain the performance of the regionalisation methods in
greater detail. Four study authors from the Level 1 assess-
ment, plus three other authors, provided detailed informa-
tion about climate and catchment characteristics in a
consistent way and reported the regionalisation performance
for each catchment (
Table A7.2
). This data set combines
Search WWH ::

Custom Search