Geography Reference
In-Depth Information
P
A
(mm/year)
1100
900
50
1.0
700
0.8
20
500
0.6
10
5
0.4
A
B
C
D
E
0.2
2
1
0.0
0.0
0.2 0.4
Event runoff coefficient
0.6
0.8
1.0
0
10 20
Percent of time exceeded
30
40
50
50 km
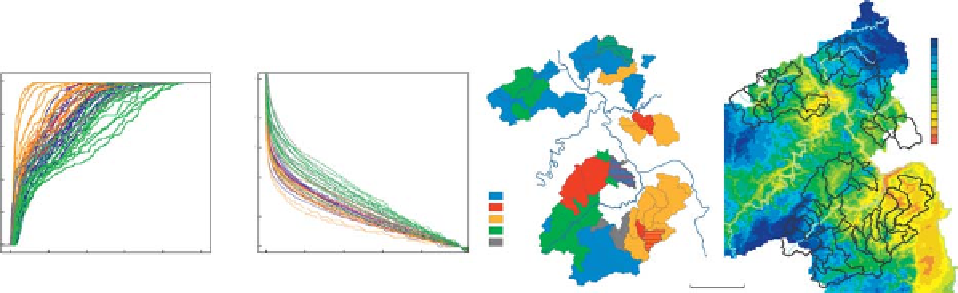
Figure 7.12. Clusters by catchment response behaviour: empirical distribution function of event runoff coefficients (ECDF), FDC (Q/Q
median
),
clusters and mean annual precipitation in Rhineland-Palatinate, Germany. From Ley et al.(
2011
).
selection of the most statistically relevant characteristics.
For instance, some clustering algorithms work on a derived
variable obtained by applying, for instance, principal com-
ponent analysis or canonical correlation analysis to catch-
ment characteristics (see e.g., Sanborn and Bledsoe,
2006
;
Sauquet and Catalogne,
2011
).
Whichever clustering method is used it is important to
give a hydrological interpretation of the groups. For
example, Ley et al.
(2011)
grouped catchments by training
self-organising maps and implementing hierarchical
clustering. They assumed catchments to be similar if the
distribution of event runoff coefficients (Merz et al.,
2006
)
and the FDCs were similar. The results of their grouping
for the Rhineland-Palatinate, Germany, are given in
Figure
7.12.
The spatial arrangement of the clusters is consistent
with the distribution of mean annual precipitation. Clusters
A and D lie in the high precipitation areas (mean annual
precipitation of around 1000 mm), Cluster C in the low
precipitation areas (600 mm), and Cluster B lies in between
these groups. They note that there is a strong positive
correlation between mean annual precipitation and the
mean event runoff coefficients. With increasing mean
annual precipitation, it is more likely that initial conditions
are wet, which increases runoff. Climate has the largest
influence on runoff, both because of the direct input to
runoff at the event scale and through the co-evolutionary
processes affecting the drainage characteristics, landform,
soils and vegetation (Sivapalan,
2005
; Norbiato et al.,
2009
).
In many cases fixed regions are obtained through clus-
tering. However, from a practical point of view, focused
pooling could be an advantage, i.e., clusters identified on
the basis of the hydrological affinity with the target site,
such as the region of influence (RoI) approach (see e.g.,
Holmes et al.,
2002
). Studies adopting focused-pooling
approaches (Holmes et al.,
2002
) predate recent applica-
tions of studies based on the identification of fixed and
contiguous regions (see, for example, the studies per-
formed by Mohamoud,
2008
, for a Mid-Atlantic Region
of the USA, by Viola et al.,
2011
for Sicily, or by Niadas,
2005
, for a western north-western region in Greece) or
application of clustering algorithms (e.g. Sanborn and
Bledsoe,
2006
, Colorado, USA, clustering on the basis of
principal component analysis, or Lin and Wang,
2006
,
Southern Taiwan, clustering algorithm with self-organising
maps).
The grouping techniques discussed above should always
be followed by interpretation and hydrological reasoning
(Merz and Blöschl
,
2008
). For example, Rianna et al.
(
2011
) applied a cluster analysis using catchment area,
altitude and geographical coordinates as explanatory vari-
ables, these being the most correlated ones with specific
quantiles of runoff. They delineated three regions in this
way, which coincide with the Apenninic, coastal and Tiber
River zones in central Italy. Since the last region turned out
to be heterogeneous according to a homogeneity test, and
because geology was suspected to be the cause, the per-
centage of substrate (volcanic or carbonatic) was added to
the other variables in the cluster analysis and different
configurations of the regions were hypothesised. In the
end, the Tiber River subcatchments were divided into
two regions at the left and right banks of the river, which
are characterised by different substrata. After the further
subdivision, all four regions turned out to be statistically
homogeneous in terms of shape of the FDCs.
7.3 Statistical methods of predicting flow duration
curves in ungauged basins
The grouping methods discussed above can assist in pre-
dicting FDCs in ungauged basins. The focus of this section
is on their prediction with statistical methods on the basis
of FDCs in neighbouring catchments and catchment/
Search WWH ::

Custom Search