Geography Reference
In-Depth Information
0.2
10
-1
Fast preferential flow
Fast
preferential
flow
Slow preferential flow
10
-2
Slow
preferential
flow
10
-3
Matrix flow
0.1
10
-4
Matrix flow
10
-5
0.0
0.0
0.2
0.4
0.6
0.8
1.0
0
50
100
150
Probability of exceedence
Time (hrs)
Q
f
controls the upper part
Q
u
controls the middle part
Q
u
: a simple
function of monthly
flow regime
Q
f
: a simple
function of P
Percent of time exceeded
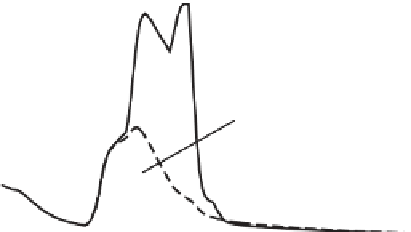
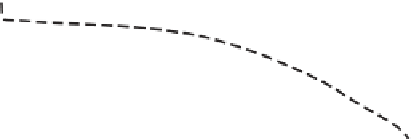
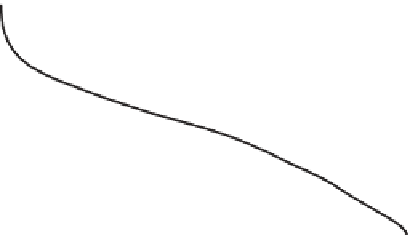
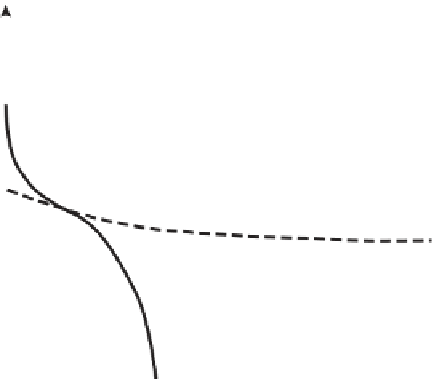
Figure 7.4. Illustration of process controls of different parts of the FDCs. (Top left) Model-predicted contributions of matrix flow and hillslope
preferential flow, fast and slow, to runoff at hillslope scale for a single flood event. (Top right) Contributions of model-predicted matrix flow and
preferential flows (fast and slow) to the FDC for a given water year (Beckers and Alila,
2004
). (Bottom) Schematic diagram illustrating the
understanding gained through model simulations regarding the shapes of the FDCs and controls on the different parts of the FDC based on the
partitioning of total runoff into fast (Q
f
) and slow (Q
u
) flows (Yaeger et al.,
2012
; Yokoo and Sivapalan,
2011
).
of runoff), which is the subject of study in
Chapter 6
. They
can also manifest in the shape of the FDC, as shown in
Figure 7.5
, which presents several examples of both
regime curves and FDCs from several catchments located
across the continental USA. The results presented in
Figure
7.5
show that the removal of the time element leads to the
possibility that two catchments with different regime
curves may yet have similar shapes of the FDCs, especially
in humid catchments. For the catchment in Montana (MT)
(
Figure 7.5
, red line) the peak in runoff caused by snow-
melt is quite prominent, but for the rest of the year, runoff
is relatively constant. This is manifested in the flat slope
of the FDC, with a slight uptick at the low-probability
end that includes the annual snowmelt events. Contrast
this with the ephemeral, semi-arid catchment in Northern
California (
Figure 7.5
, black line), where the runoff varies
a great deal throughout the year, manifested in a much
steeper FDC overall, and tending to zero runoff at 90%
exceedance probability. Catchments with very different
runoff coefficients have different FDCs, whereas catch-
ments with very similar runoff coefficients have similar
FDCs, as illustrated by two forested catchments in
Pennsylvania (PA) and Virginia (VA) (
Figure 7.5
,blue
and yellow lines respectively). In both of these catchments
the seasonal pattern of leaf-out in the spring and leaf-drop
in the fall (i.e., indicators of phenology) are seen in
the decrease in runoff from about May to October, even
though the precipitation is fairly constant all year. The effect
of phenology is less clear in the FDC, however, where the
two catchments are nearly indistinguishable from one
another and only slightly different from the Montana (MT)
catchment. The results presented in
Figure 7.5
highlight


Search WWH ::

Custom Search