Geography Reference
In-Depth Information
runoff in snow-dominated catchments is easy to predict. In
contrast, in the USA, high elevations correspond to arid
places in the western part of the country, for which the
prediction is harder. A similar pattern occurs for the spatial
proximity method. The performance of geostatistics does
not show a dependence on elevation or temperature as it is
always very good. There is a slight increase in NSE pre-
dictive performance with elevation for the process-based
approach. The predictions at the lowest elevations are
slightly biased (
Figure 6.30
), which may be due to the
weaker seasonality.
The performance of the geostatistical methods increases
with catchment area. As the catchment area increases, the
overlapping areas between gauged and ungauged catch-
ments tend to be bigger, so the correlations along the stream
network are likely to increase, which will improve the
performance of the geostatistical methods. In the case of
regression, the NSE performance increases with catchment
area in Austria and slightly decreases in the USA (
Figure
6.28
). These differences may be related to the co-location of
catchments with climate regions. In Austria aridity tends to
increase with catchment area while in the USA it tends to
decrease. Overall, the performances in the USA tend to be
higher. In Austria a single (global) regression was used,
while in the USA regional regressions were used that may
be better suited for accounting for differences in the hydro-
logical processes. The NSE performance of the spatial
proximity method tends to decrease with catchment area,
which is related to the selection of donor catchment on the
basis of geographical distance between the catchment
outlets of the gauged and ungauged catchments, so may
not be a good assumption for large catchments.
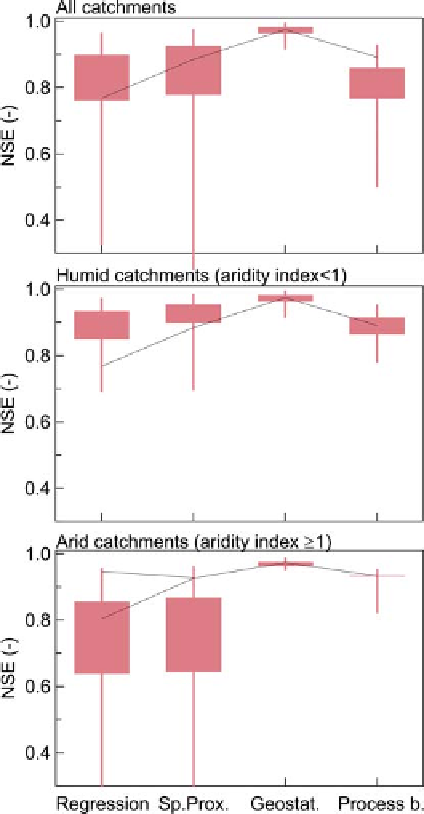
Figure 6.31. Nash
Sutcliffe efficiency (NSE) of predicting the Pardé
coefficients of seasonal runoff in ungauged basins for different
regionalisation methods, stratified by aridity. (Top) All catchments;
(centre) humid catchments (aridity index
-
Which method performs best?
Figure 6.31
summarises the performance for different
regionalisation approaches, stratified by the aridity index.
The top, middle and bottom panels show the performance
for all catchments in Table A6.2, and catchments with an
aridity index below and above 1, respectively. In all cases
geostatistical methods perform much better than any other
method. This is because the processes driving seasonal
runoff (seasonality in precipitation, storage) are smooth
in space, so seasonal runoff is also smooth. This is exactly
the assumption geostatistics is based on. It is interesting
that geostatistics performs much better than the spatial
proximity method for the same data set (black line). Both
methods use spatial distance as a similarity measure but
spatial distance is defined differently. In the case of the
spatial proximity method distance is defined as geograph-
ical distance between the catchment outlets of the gauged
and ungauged catchments. In the geostatistical methods
used here, distance is defined in a way that takes into
<
1); (bottom) arid
catchments (aridity index
1). Lines connect median efficiencies
for the same study. Boxes are 40%
≥
-
60% quantiles, whiskers are
20%
-
80% quantiles.
account the nested organisation of the landscape into
catchments and the stream network. Clearly, the stream
network structure is a spatial landscape feature that should
be explicitly represented when estimating seasonal runoff
in ungauged basins.
In humid catchments spatial proximity is the second best
approach, while for arid catchments spatial proximity does
not perform better than regression methods. This is
because arid regions tend to be more heterogeneous than
humid ones. Process-based methods show good results in
arid catchments, but only a few catchments were available
to assess the performance.
Search WWH ::

Custom Search