Geography Reference
In-Depth Information
Regression
Spatial proximity
Geostatistics
Process based
1.0
0.8
0.6
0.4
0.2
0.0
0.4
0.6 0.8 1.0 2.0
0.4
0.6 0.8 1.0 2.0
0.4
0.6 0.8 1.0 2.0
0.4
0.6 0.8 1.0 2.0
E
PA
/
P
A
(-)
E
PA
/
P
A
(-)
E
PA
/
P
A
(-)
E
PA
/
P
A
(-)
1.0
0.8
0.6
0.4
0.2
0.0
3
6
8
10
12
3
6
8
10
12
3
6
8
10
12
3
6
8
10
12
T
A
(
C)
T
A
(
C)
T
A
(
C)
T
A
(
C)
1.0
0.8
0.6
0.4
0.2
0.0
3
Elevation (10
2
m a.s.l.)
6
9
12
15
3
Elevation (10
2
m a.s.l.)
6
9
12
15
3
Elevation (10
2
m a.s.l.)
6
9
12
15
3
Elevation (10
2
m a.s.l.)
6
9
12
15
1.0
0.8
0.6
0.4
0.2
0.0
0.05
0.1 0.5
1
5
0.05 0.1 0.5
1
5
0.05 0.1 0.5
1
5
0.05 0.1 0.5
1
5
Area (10
3
km
2
)
Area (10
3
km
2
)
Area (10
3
km
2
)
Area (10
3
km
2
)
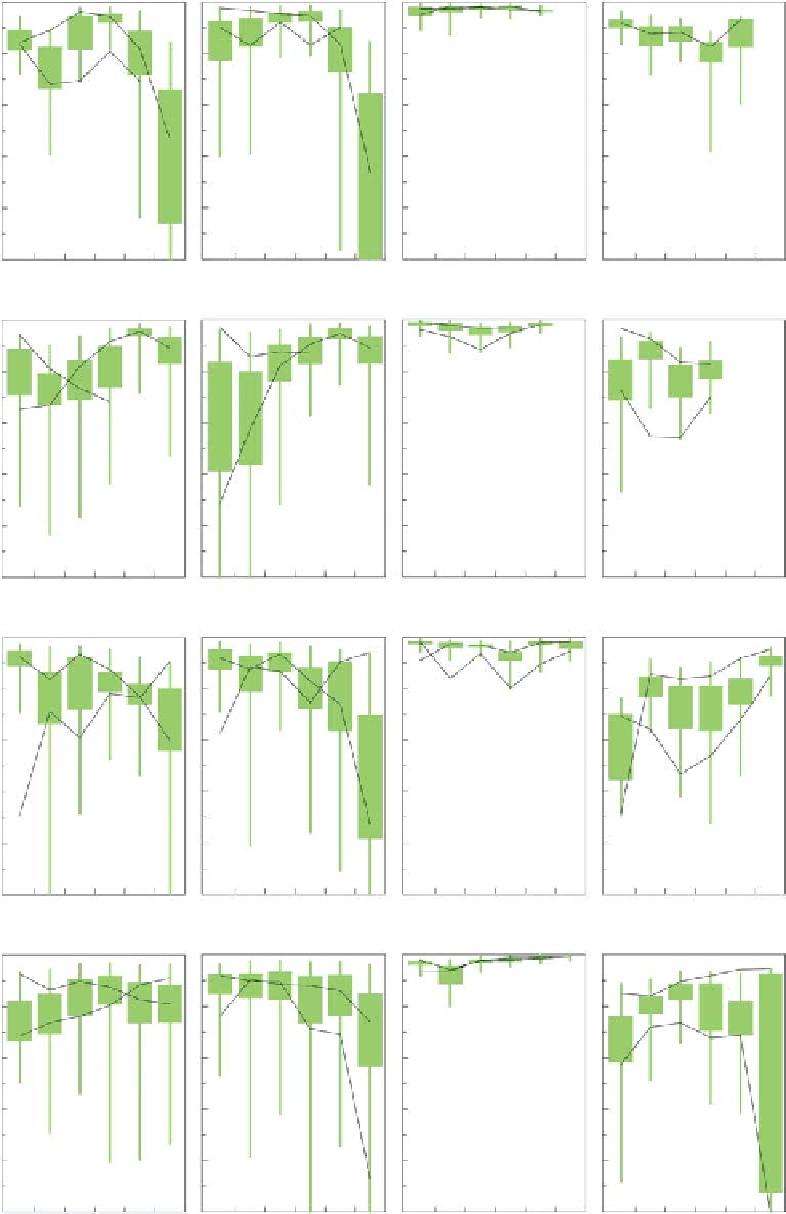
Figure 6.28. Nash
Sutcliffe efficiency (NSE) of predicting the Pardé coefficients of seasonal runoff in ungauged basins as a function of
aridity (E
PA
/P
A
), mean annual air temperature (T
A
), mean elevation and catchment area for different methods. Lines connect median
efficiencies for the same studies. Boxes are 40%
-
-
60% quantiles, whiskers are 20%
-
80% quantiles.
Search WWH ::

Custom Search