Geography Reference
In-Depth Information
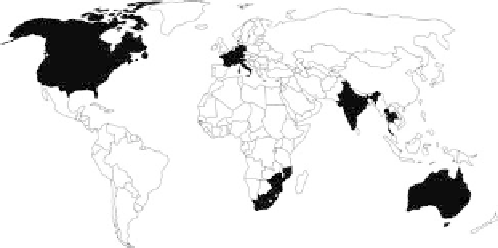
Figure 6.24. Map indicating the countries included in the Level 1
assessment.
Figure 6.25. Median Nash
Sutcliffe efficiency (NSE) (circles),
median spatial per-month adjusted r
2
(pluses) and median Spearman
correlation coefficient (squares) of predicting seasonal runoff in
ungauged basins stratified by climate. Each symbol refers to a result
from the studies shown in Table A6.1. Lines indicate studies where
the same method was applied across different climate regions. Boxes
show 25%
-
75% quantiles.
-
that applied geostatistics for a total of three regions in
France, and process-based methods including six studies
that used different rainfall
runoff models.
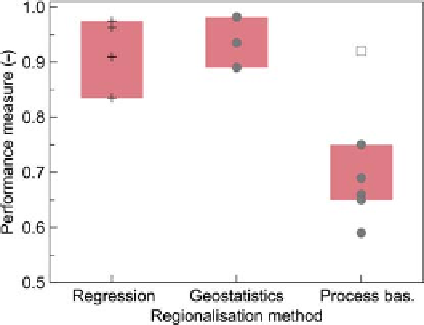
Figure 6.26
shows that, overall, geostatistics works best. The NSE
(full circles) obtained with geostatistics is around 0.9,
while it is around 0.7 for process-based methods. In this
latter case, the efficiency is calculated on the entire
simulated monthly time series and not on 12 values only,
which may partly explain the lower performance. All
geostatistical methods included in
Figure 6.26
are from
France. They include catchments from the more arid
south (Sauquet et al.,
2000a
), humid Brittany and Nor-
mandy, and the cold mountainous part of the Rhône-Alps
(Sauquet et al.,
2008
). The fact that the application of
geostatistics in a relatively arid area outperforms other
methods in arid regions shows that spatial proximity is a
good similarity measure for runoff regime, which is
controlled mainly by a precipitation regime that is
smooth in space, provided stream gauge density is not
too low. It is important to note that the geostatistical
methods take the stream network structure into account,
which seems to be one of the keys to good predictive
performance.
-
Figure 6.26. Median Nash
Sutcliffe efficiency (NSE) (circles),
median spatial per-month adjusted r
2
(pluses) and median Spearman
correlation coefficient (squares) of predicting seasonal runoff in
ungauged basins stratified by regionalisation method. Each symbol
refers to a result from the studies shown in Table A6.1. Boxes show
25%
-
-
75% quantiles.
2006
), indicated by the grey line in
Figure 6.25
, compared
arid, cold and humid regions, obtaining r
2
values from 0.83
in the arid region to more than 0.9 in cold and humid
regions. Interestingly, more performance assessments are
available for arid regions (Colorado, southern France,
Southern Africa, Sicily, New South Wales) and in some
of them more than one method was assessed. A number of
factors may contribute to the better performance in cold
and humid regions. These include the presence of snow
processes that tend to make the runoff regime more pre-
dictable, generally less spatial hydrological variability than
may be present in arid regions, and perhaps a higher stream
gauge density.
How does data availability impact performance?
Figure 6.27
shows the performance as a function of the
number of catchments analysed in each study. There is a
clear trend for the performance to increase with the
number of catchments (and therefore stream gauges)
available in the study. For a runoff signature such as
runoff seasonality, which varies rather smoothly in space,
Which method performs best?
The regionalisation methods represented in the assess-
ment included two studies with four different regression
models used to transfer model parameters, two studies

Search WWH ::

Custom Search