Geography Reference
In-Depth Information
Doldenhorn 3638 m
Bietschhorn 3934 m
Blüemlisalp 3661 m
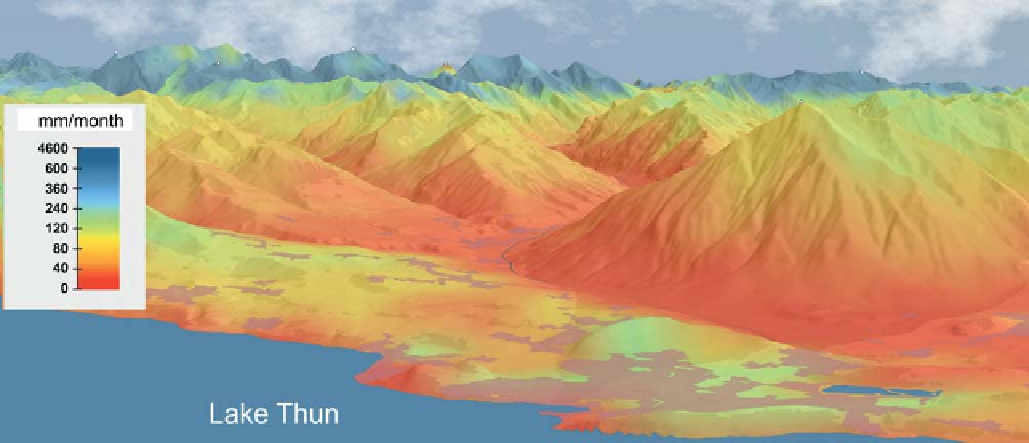
Weisshorn 4506 m
Wildstrubel 3244 m
Niesen 2362 m
Figure 6.23. Mean monthly runoff in August in the Bernese Oberland, Switzerland. From Atlas of Switzerland
(2010)
.
catchments as complex systems and provides guidance on
what methods to choose in a particular environment. The
assessment is performed at two levels (see
Section 2.4.3
).
The Level 1 assessment is a meta-analysis of studies
reported in the literature. The Level 2 assessment involves
a more focused and detailed analysis of individual basins
from selected studies of Level 1 in terms of how the
performance depends on climate and catchment character-
istics as well as on the method chosen. In both Level 1 and
Level 2 assessments, the performance was evaluated by
leave-one-out cross-validation, where each catchment was
treated as ungauged and the runoff predictions were then
compared to the observed runoff. The performances
obtained by the comparative assessment are estimates of
the total uncertainty of
regionalisation approaches, giving a total of 13 results for
predictive performance. The regionalisation methods used
are regression, geostatistics and process-based approaches.
The studies are quite heterogeneous in terms of perform-
ance measures and the way they were applied. The per-
formance measures used are the median Nash
Sutcliffe
efficiency (NSE) of the 12 long-term mean monthly runoff
values, with the exception of two studies that used monthly
runoff time series. One study reported the median of the r²
calculated from comparing predicted specific runoff for
each month independently. Another study reported the
Spearman correlation coefficient of the long-term mean
monthly runoff. Even though these performance measures
are not strictly speaking comparable, values close to 1
imply good performances, and smaller values imply a
lower performance. Different performance measures are
indicated by different symbols in the plots. For comparison
with the other runoff signatures in
Chapter 12
, the median
NSE of monthly runoff were calculated for all methods in
all studies. The 25% and 75% quantiles of these NSE are
0.66 and 0.89, respectively.
Figure 6.24
and Table A6.1 indicate that the studies
were performed in North America, Europe, South Africa
and Australia. Three main science questions are addressed
below.
-
runoff predictions
in these
ungauged basins.
6.5.1 Level 1 assessment
Table A6.1 (Appendix) lists the 26 individual studies
reporting the performance of prediction of seasonal runoff
in ungauged basins. Some of the studies reported perform-
ance measures that were not compatible with the other
studies and/or performed goodness of fit analysis instead
of cross-validation. The remaining seven studies per-
formed leave-one-out cross-validation and the performance
measures were broadly similar. These were used in the
Level 1 assessment (indicated in Table A6.1). The number
of catchments evaluated in each study ranged from 8 to
226, with a median of 38. There are several studies
that
How good are the predictions in different climates?
Figure 6.25
shows that the performance in cold and humid
regions is significantly better than in arid regions. The
median NSE increases from around 0.7 for arid to more
than 0.9 for humid areas. One study (Sanborn and Bledsoe,
compared different hydrological models and/or
Search WWH ::

Custom Search