Geography Reference
In-Depth Information
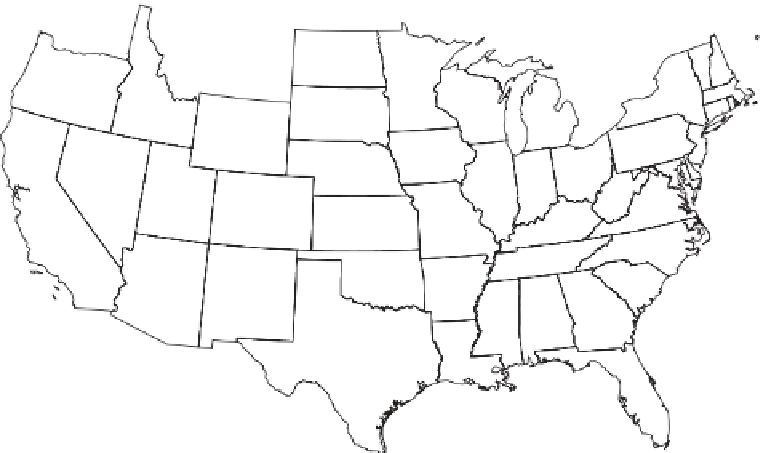
Figure 6.11. Classification
of 428 catchments in the
USA on the basis of
similarity of seasonal flow
regimes. From Coopersmith
et al.(
2012
).
Classes for 428 MOPEX Catchments
IACJ
IAF
IAQ
IHM
ISCB
ISCJ
ISQJ
ITC
ITF
IVD
LBMH
LBMS
LJ
LPC
LPM
LPQ
LWC
XACJ
XADB
XHD
XSC
XSMB
XTM
XVM
other, then climate and catchment characteristics can plaus-
ibly be used to group catchments with similar flow regimes
(
Section 6.2.3
) and to estimate flow regimes for ungauged
basins (
Sections 6.3
and
6.4
).
Swiss Alps (Aschwanden and Weingartner,
1985
); the
development of composite indices, including timing and
intensity of peak mean runoff and annual runoff (Grimm,
1968
); and spectral analyses, where the monthly runoff is
decomposed into harmonic components (Fourier series).
The relative magnitude of the components of different
wavelengths can then be used to classify and regionalise
flow regimes by mapping and/or interpolation (Herrmann,
1970
; Herrmann and Egger,
1980a
,
1980b
; Aschwanden
and
Weingartner,
1985
; Shun and Duffy,
1999
). Wavelet
analysis, which allows for time variation in the harmonics,
is gaining attention in flow regime studies (e.g., Smith
et al.,
1998
; Massei et al.,
2009
; Rossi et al.,
2009
).
Runoff similarity indices
Similarity in runoff seasonality between catchments may
be accounted for by considering the shape and magnitude
of the flow regime curves independently or jointly
(Hannah et al.,
2000
,
2005
). Qualitative approaches
involve an interpretation of spatial patterns of the flow
regime curves when superimposed on maps. The resulting
classifications are usually discriminated between different
sources of runoff (rain, glaciers, snowmelt, groundwater)
and quantitative measures of the regime pattern (Krasovs-
kaia,
1997
). There have been many attempts to relate
indices describing the regime type (e.g., the timing of run-
off maxima and minima, the number of peaks or the
amplitude of the flow regime curve) to the dominant pro-
cesses (precipitation, evaporation, storage etc.). These
efforts are often most successful in heterogeneous regions
where water sources and dynamics vary markedly through
space. Other similarity metrics include the ranking of
monthly mean runoff, which has been used to distinguish
glacial regimes (which have highest monthly mean runoff
occurring in July followed by August and June) from snow
regimes (where the ranking is June
Climate similarity indices
The seasonal flow regime is controlled by the relative
timing of precipitation and potential evaporation, and the
ability of the landscape to store water. Climate similarity
indices that capture such variation include the Köppen
-
Geiger classification (Köppen and Geiger,
1936
; Peel
et al.,
2007
), and the aridity index (Budyko,
1974
) (see
Section 5.2.1
). Climate similarity indices have been effect-
ively related to the seasonal flow regime, using a combin-
ation of the aridity index, seasonality indices for
precipitation including its variability and timing, and timing
of peak runoff (Coopersmith et al.,
2012
). As shown in
Figure 6.11
, Coopersmith et al.(
2012
) found that 331 out
-
May
-
July) in the


Search WWH ::

Custom Search