Geography Reference
In-Depth Information
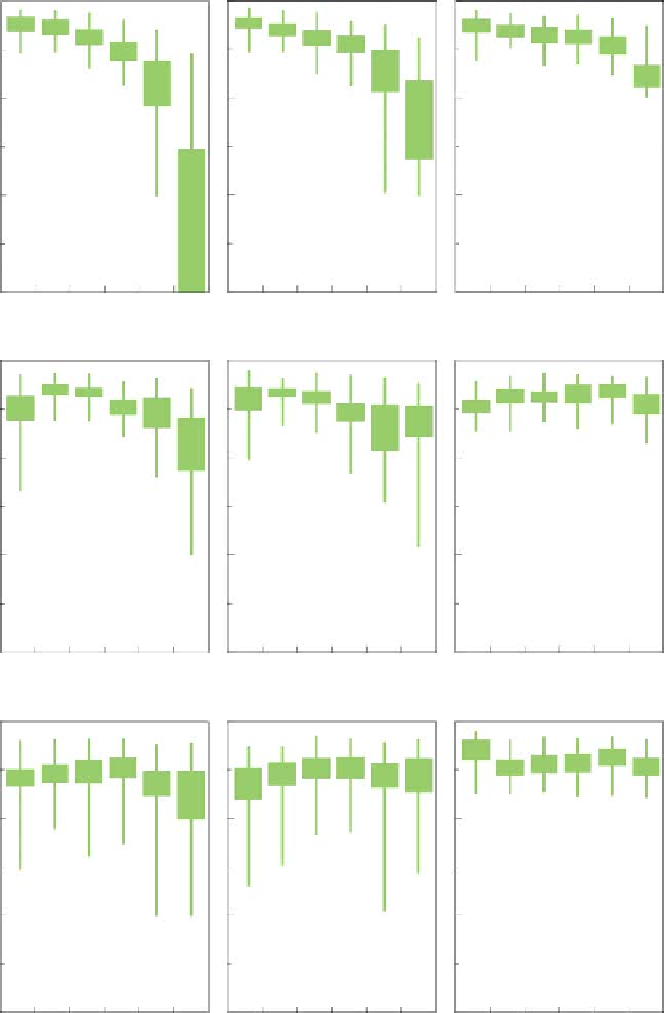
Figure 5.27. Absolute normalised
error (ANE) of predicting annual
runoff in ungauged basins as a
function of aridity (E
PA
/P
A
), mean
annual air temperature (T
A
) and
catchment area for different methods.
Boxes are 40%
-
60% quantiles,
whiskers are 20%
-
80% quantiles.
Global regr.
Regional regr.
Budyko
0.0
1.0
2.0
3.0
0.4
0.6 0.8
1.0 2.0
0.4
0.6
0.8
1.0
2.0
0.4
0.6
0.8
1.0
2.0
E
PA
/
P
A
(-)
E
PA
/
P
A
(-)
E
PA
/
P
A
(-)
0.0
1.0
2.0
3.0
3
6
8
10
12
3
6
8
10
12
3
6
8
10
12
T
A
(
°
C)
T
A
(
°
C)
T
A
(
°
C)
0.0
1.0
2.0
3.0
0.05
0.1
0.5
1
5
0.05
0.1
0.5
1
5
0.05
0.1 0.5
1
5
Area(10
3
km
2
)
Area(10
3
km
2
)
Area(10
3
km
2
)
for the global regression: catchment area, mean annual
precipitation and air temperature); a process-based (con-
ceptual soil moisture accounting model at the daily time
scale); and a geostatistical method (top-kriging). Overall
the performance is much better than that of the global
predictions as one would expect given the higher data
availability. The global regression model gives ANE of
around 0.3 as opposed to 0.4 for all humid catchments of
the Level 2 assessment (
Figure 5.29
) indicating that the
Austrian data set is in a range where the regression
model works well. The Budyko model and the regional
regressions perform better than the global regressions.
Note, again, that Budyko was not calibrated to the Aus-
trian data, while the regional regressions were. The
Search WWH ::

Custom Search