Geography Reference
In-Depth Information
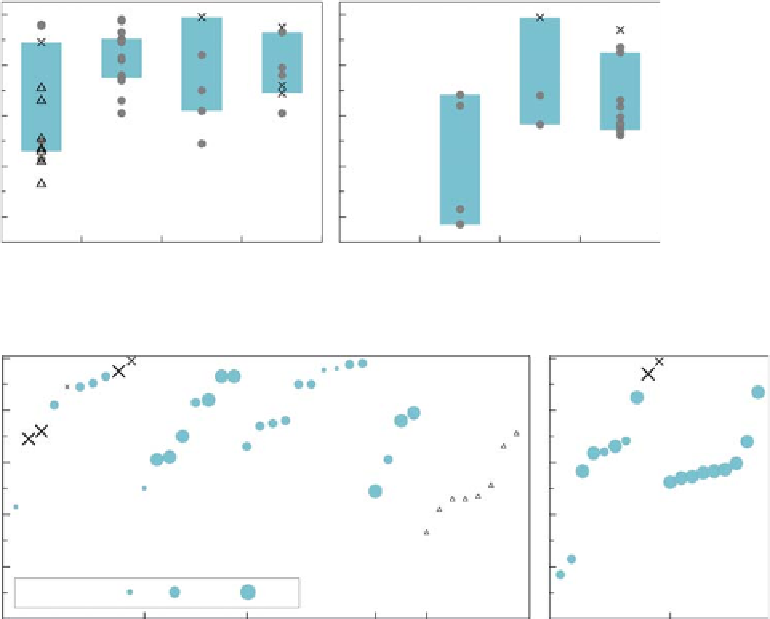
Figure 5.25. Squared correlation
coefficient (r
2
) of predicting annual
runoff (left) and inter-annual
runoff (right) in ungauged basins
stratified by the number of
catchments within each study.
Each symbol refers to a result from
the studies shown in
Table A5.1
(annual runoff) and
Table A5.2
(inter-annual runoff). Triangles
indicate the temporal variability
assessment based on tree rings.
Boxes show 25%
Annual runoff
Interannual variability
1.0
0.8
0.6
0.4
0.2
20 100 250
Number of catchments
20
100
250
-
75% quantiles.
Number of catchments
Annual runoff
Interannual variability
1.0
0.8
0.6
0.4
0.2
No. of catchments:
<20
20-200
>200
0.0
Regression
Index
Sp.proximity
Process b. Tree-ring
Regression
Index
Regionalisation method
Regionalisation method
Figure 5.26. Squared correlation coefficient (r
2
) of predicting annual runoff (left) and inter-annual runoff (right) in ungauged basins
stratified by the regionalisation method and ranked by performance. Each symbol refers to a result from the studies shown in
Table A5.1
(annual
runoff) and
Table A5.2
(inter-annual runoff). Circles refer to the performance indicators based on specific runoff, crosses to the ones based
on volumetric units. Circle size indicates number of catchments per study.
have been mainly tested for data sets with less than 200
catchments. The type of method seems to more strongly
control the performance than the number of catchments per
study.
The comparison between regression and index methods
for inter-annual runoff variability indicates that the
methods have been tested on very similar data set sizes
with similar performance.
Predictions of mean annual runoff do not depend on the
number of catchments in the study, while predictions of
annual runoff variability improve with the number of
catchments.
5.5.2 Level 2 assessment
The Level 1 synthesis of existing studies (
Table A5.1
)
clearly showed that many studies only report summary
statistics of regionalisation performance and/or catchment
characteristics, which hampers detailed attribution of the
performance and inter-study comparison of results. The
objective of the Level 2 synthesis is to examine and
explain the performance of the regionalisation methods in
greater detail. The Level 2 assessment is based on the
global data set of Peel et al.(
2010
) that provided detailed
information about climate and catchment characteristics in
a consistent way and reported the regionalisation perform-
ance for each catchment. This data set combines data from
Main findings of Level 1 assessment
In cold and humid regions the performance of predicting
the mean and variability of annual runoff in ungauged
basins tends to be better than in other climates.
Methods based on spatial proximity perform best,
followed by index methods and regressions, which per-
form similarly.
At the scale of the analysis (regional and global) the
performance of the processed methods available for the
analysis is lower. Calibration seems to be essential.
Search WWH ::

Custom Search