Geography Reference
In-Depth Information
(Global Soil Data Task Group,
2000
); in some countries a
higher resolution national data set is available. Milly
(
1994b
) showed that a model of this simplicity was unable
to reliably predict annual runoff throughout central and
eastern USA, mainly because temporal fluctuations in
water availability at the event scale were not represented.
Models that include event-scale storage processes include
Milly
100
5
4
80
E
P
60
3
P
s stochastic soil water model (Milly,
1993
; Potter
and Zhang,
2009
), Woods (
2003
) and the stochastic-
dynamic soil water storage model of Rodriguez-Iturbe
(Rodriguez-Iturbe et al.,
1999
; Laio et al.,
2001
; Porporato
et al.,
2004
). See Milly (
2001
) for a comparison of some of
these approaches.
Based on a theoretical analysis of an idealised water
balance, Milly (
1994b
) developed analytical solutions to
estimate annual runoff, representing both event-scale and
seasonal variations in climate. He tested this method with-
out model calibration, for data from catchments located
east of the Rocky Mountains in the USA. He concluded
that the seasonal fluctuation of the forcings was always
relevant, especially in arid catchments, while the effect of
local spatial variability of soil water holding capacity on
annual runoff was negligibly small. By extending Milly
'
40
2
P
-
E
P
Runoff
1
20
0
0
0
50
100
150
200
250
300
350
Day of Year
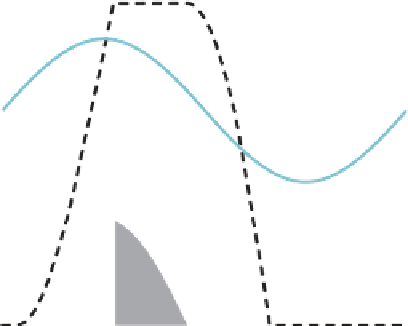
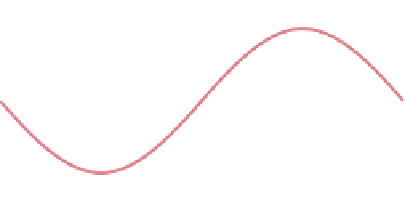
Figure 5.19. Simple model of the interaction between mean climate,
seasonality and soil water storage.
equations over the distribution of inputs, to obtain the
probability distribution of the model output. This tech-
nique is known as the derived distribution approach. There
are many examples of applications of this approach in
hydrology (e.g., Eagleson,
1972
; Hebson and Wood,
1982
; Ramirez and Senarath,
2000
; Sivapalan et al.,
2005
). To estimate annual (or shorter time-step) runoff,
Budyko-type models require modification to account for
the catchment water storage (Zhang et al.,
2008a
; Tekleab
et al.,
2011
). Models that incorporate monthly or seasonal
storage processes include the
s
approach to include variable phase shifts in the representa-
tion of seasonal climate, Potter et al.(
2005
) made esti-
mates of the water balance of 262 Australian catchments;
results are presented in
Figure 5.20
. Potter et al.(
2005
)
found satisfactory results except for catchments with
summer-dominated rainfall, where they hypothesised that
infiltration excess was a dominant runoff generation mech-
anism, not represented in their model.
In their analytical approach, Sankarasubramanian and
Vogel (
2002
) adopted the
'
model (Thomas,
1981
;
Sankarasubramanian and Vogel,
2002
), Milly
'
abcd
'
s seasonal
water storage model (Milly,
1994b
), and the combined
seasonal/event model of Woods (
2003
).
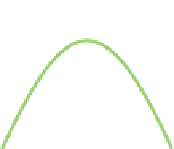
Figure 5.19
shows a simplified example of this type of
model. Precipitation and potential evaporation are assumed
to be sine curves (blue and brown traces), and their differ-
ence (green trace) is the excess water available. A soil
water store (black dashed trace) fills during the first part
of the wet season (when P
'
model (Alley,
1984
)as
an alternative to Budyko-type models in order to be able to
account for effects of the dynamics of soil moisture. They
derived relationships capable of predicting actual evapor-
ation and the inter-annual variability of runoff, which
depended on both the aridity index and a soil moisture
storage index, related to one of the model parameters. To
apply the method to ungauged catchments, the soil mois-
ture storage index was estimated using monthly time series
of precipitation, potential evaporation and an estimate of
maximum soil moisture holding capacity. This is available
globally at a 0.5 degree resolution (Dunne and Wilmott,
1996
).
'
abcd
'
E
p
), and once storage reaches
its capacity (90 mm in this case), any further excess water
generates runoff (solid black region). The area of the black
region is the annual runoff. Water is assumed to evaporate
at the potential rate during the wet season and whenever
stored water is present. Once the dry season begins (when
P
<
E
p
), storage starts to empty, with water evaporating at
the potential rate until storage is exhausted.
Models such as that shown in
Figure 5.19
can be imple-
mented for ungauged catchments if climate and soil water
holding capacity data are available. Global data sets exist
for precipitation (New et al.,
2002
), potential evaporation
(Ahn and Tateishi,
1994
) and soil water holding capacity
>
5.4.2 Continuous models
Annual runoff and inter-annual variability
Hydrologists now have access to a plethora of conceptual
precipitation
runoff models. These range from simple
single storage models with annual time steps, through to
complex theoretically based models with time steps of less
-


Search WWH ::

Custom Search