Geography Reference
In-Depth Information
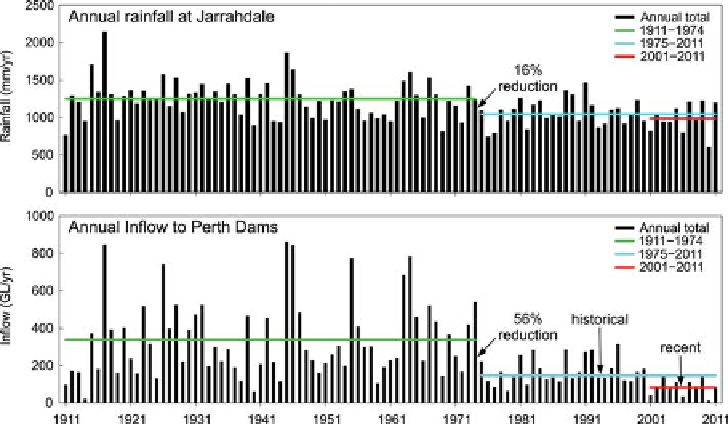
Figure 5.8. Reduction in runoff in
the south-west of Western Australia,
and its relation to annual rainfall.
Data from the WA Water
Corporation.
is considerable variability in the timing and sometimes
directionality of water balance responses
Within-year variability and in particular the relative
seasonality of (or phase difference between) precipitation
and potential evaporation also impact runoff variability.
This seasonality can be computed with a seasonality index,
|
to change
(Andréassian,
2004
; Brown et al.,
2005
).
δ
E
are the amplitudes of
the precipitation and potential evaporation curves.
Figure
5.9b
presents the global distribution of the phase differ-
ences between precipitation and potential evaporation.
A combination of the aridity index and the relative season-
ality are needed to predict annual runoff in some regions.
For example, in Mediterranean climates (e.g., south-west
Western Australia, Southern California, southern Spain
etc.) observed runoff amounts are inconsistent with predic-
tions made from the annual aridity index: the prevailing
out-of-phase seasonality (
Figure 5.9b
) elevates seasonal
runoff production.
Figure 5.9c
shows the inter-annual
variability of annual precipitation, expressed as the coeffi-
cient of variation; it is typically largest in arid locations
(
Figure 5.9a
).
Catchment similarity indices: Within a region with
homogeneous climate (e.g., similar aridity values, similar
seasonality of precipitation and potential evaporation), dif-
ferences in annual runoff relate to catchment processes,
e.g., storage and vegetation uptake. Similarity indices to
describe these processes should reflect soil water holding
capacity, soil texture (or saturated hydraulic conductivity),
topographic slope and vegetation cover.
A dimensionless similarity framework for quantifying
the relative roles of multiple factors in annual water bal-
ance was developed by Woods (
2003
) based on the pion-
eering work by Milly (
1993
,
1994a
,
b
), and by Yokoo et al.
(
2008
) based on the physically based model of annual
water balance by Reggiani et al.(
2000
). A similar frame-
work was developed by Jothityangkoon and Sivapalan
δ
P
−
E
p
δ
E
/P|, where
δ
P
and
5.2.2 Similarity measures
The process controls on annual runoff variability described
above point naturally to indices or similarity measures that
can be used to organise regions into groups with similar
hydrological characteristics. Similarity measures can be
defined to describe runoff patterns, climate and catchment
morphology.
Runoff similarity: Based on runoff data, the similarity
between catchments can be expressed in terms of mean
annual runoff (flow volume rescaled by catchment area), or
in terms of a runoff ratio (or coefficient): the ratio of mean
annual runoff to mean annual precipitation. Inter-annual
variability can be expressed in terms of the coefficient of
variation (CV) of annual runoff, or in terms of a growth
curve (cumulative distribution rescaled by the mean).
Catchment responses to dynamic changes in climate or
land use can be captured in terms of runoff elasticity, i.e.,
proportional change in runoff divided by proportional
change in the climate or land use feature. For example,
the precipitation elasticity could be defined as the propor-
tional change in annual
runoff over
the proportional
change in annual precipitation.
Climate similarity indices: Given the primary control of
water and energy availability on annual runoff variability, the
aridity index, E
p
/P, is an obvious climate similarity measure
with a proven predictive capacity.
Figure 5.9a
shows a global
map of the aridity index. Locations with high aridity index
usually have low runoff ratios, i.e., mean annual runoff is a
small fraction of mean annual precipitation.
Search WWH ::

Custom Search