Database Reference
In-Depth Information
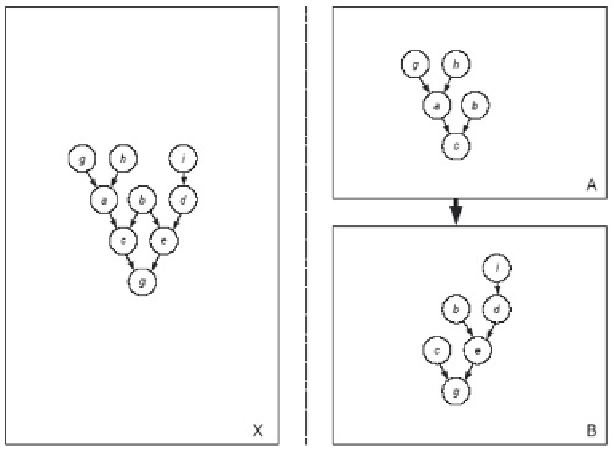
Table 1: Cohesion Coeffi cients for Figure 1
X
A
B
relation cohesion
2/7
5/12
2/3
information cohesion
6/16
3/8
2/9
total cohesion
12/112 (≈ 0.1)
15/96 (≈ 0.2)
4/27 (≈ 0.2)
Somebody who is to perform this task may easily wonder what the processing of
a
,
b
,
c
,
d
,
e
,
f
has to do with the processing of
f
has to do with the processing of
f m
,
n
,
i
,
j
,
k
. Obviously, we cannot say anything at this
point about, e.g., the semantical resemblances between the various operations.
To appreciate the heuristic's opposite discrimination consider the example as given in
Figure 2, based on the operations structure (
D
Figure 2, based on the operations structure (
D
2
,
O
2
) with
D
2
= {
a, b,…, i
}and
O
and
O
2
={(
a
, {
g
,
h
}),
(
d
, {
f
,
f c
,
e
})}. It again represents two alternatives in the fashion
of the fi rst example. The various cohesion coeffi cients are given in Table 2.
Perhaps the reader may be under the impression that the relation cohesion and infor-
mation cohesion coeffi cients are highly related. However, it is possible to think of various
activities with very different distributions of the respective metric. It is, for example, possible
to think of an activity with one type of cohesion that equals 1, while the other almost equals
0. Because of limitations of space, actual examples are not given here.
d
,
d i
}), (
c
, {
a
,
b
}), (
e
, {
b
,
d
}), (
f
}), (
f
}), ( , {
Figure 2