Information Technology Reference
In-Depth Information
Endothelial cells
Circumferential
stretch
Shear str
ess
(a)
(b)
(c)
Figure
16.8.
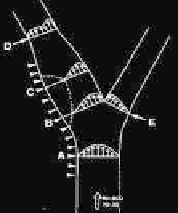
(a) Schematic drawing that shows the regions of curvatures and
straight segments of the aorta. (b) Endothelial cells (EC) at the aortic arch
experience disturbed flow, assuming random morphology, whereas in the
straight portion, EC line in the direction of blood flow. (c) The arterial wall is
exposed to circumferential stretch, wall shear stress, and hydrostatic force that
acts perpendicularly on the inner wall.
(Fig. 16.9). Thus, direct measurement of shear stress is clinically relevant to the
athero-prone regions.
The understanding of lipid biochemistry leads to the development of indium
oxide (In
2
O
3
) nanowire sensors to investigate whether LDL particles preferentially
undergo oxidative modification [29] at the arterial bifurcations where flow
50.0
40.0
30.0
M
20.0
2.0
3.0
10.0
0.0
0.0
1.0
2.0
3.0
time(sec)
Oscillating shear stress
L
4.0
3.0
2.0
1.0
0.0
0.0
1.0
2
.0
3.0
4
.0
5.0
6
.0
−
10
−
20
−
30
−
40
time(sec)
c) Disturbed flow
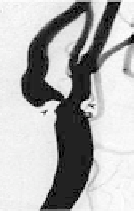
d) Angiograms
a) Reconstructed flow profiles
b) 2D Profile at steady stats
Figure
16.9.
(a) Shear stress profiles at the lateral (L) and medial (M) walls of
arterial bifurcations. (b) Pulsatile shear stress develops at the medial wall (M),
whereas oscillating flow develops at the lateral (L) wall where migrating
stagnation point occurs. (c) The lateral wall is the region where flow separation
and disturbed flow develop. (d) Arterial angiogram shows the predilection sites
for plaque formation.


Search WWH ::

Custom Search