Information Technology Reference
In-Depth Information
Figure
7.15.
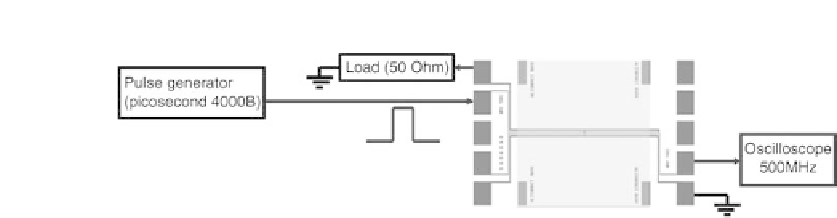
Spin-wave voltage detection set-up.
input port. In Figure 7.16, we present our experimental results on spin-wave
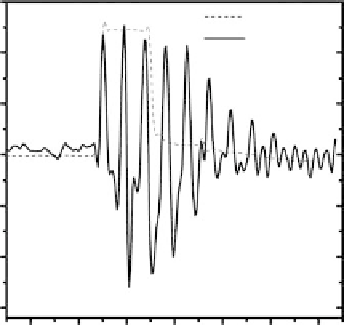
detection by the time-resolved inductive voltage measurement technique [1]. The
dashed line depicts the voltage pulse applied to the excitation line. One can see
the inductive voltage oscillation at the detection line, which is caused by the
inductive coupling via the spin waves. The output voltage signal has maximum
pulse amplitude of 26mV, and the period of oscillation is 9 ns.
These experimental data illustrate the possibility of signal transmission by
spin waves over micrometer range distances. The attenuation time is about 20 ns,
and the signal-to-noise ratio is satisfactory (at least for 8
m
m propagation
distance). We would like to stress that the utilization of spin waves is prominent
for short-range on-chip communication. There are two important issues that
require additional consideration: (i) power dissipation in spin-wave bus and
(ii) signal gain. In principle, the energy per spin wave can be scaled down to
several kT, just above the thermal noise level. On the other hand, in order to
30
30
Input
Output
20
20
10
10
0
0
−
10
−
10
−
20
−
20
−
30
−
30
60
80
100
120
Time (ns)
140
160
180
Figure
7.16.
Experimental data on spin-wave detection.


Search WWH ::

Custom Search