Geoscience Reference
In-Depth Information
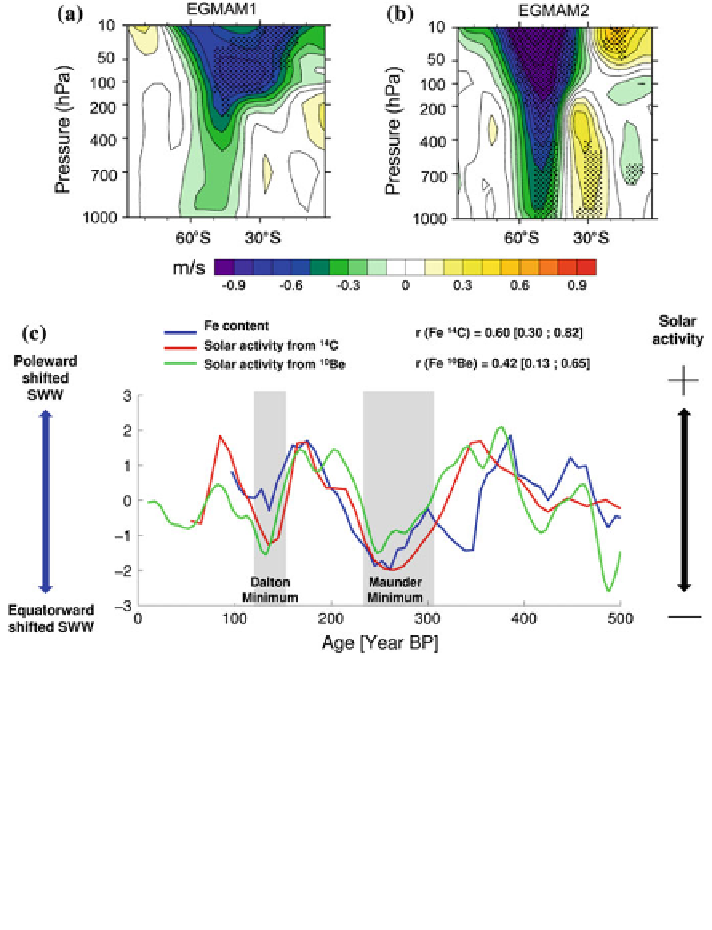
Fig. 2 Annual-mean zonal wind anomalies (LMM-mean minus PI-mean) in the EGMAM
simulations along with the reconstructions for SWW position and solar activity. a and b Zonally
averaged zonal wind anomalies in the Southern Hemisphere in EGMAM1 (fixed ozone) and
EGMAM2 (varying ozone) simulations respectively. Stippling indicates significance of the
anomaly at the 0.05 level according to a Student
s t-test. c Reconstruction of the SWW position
[blue line, based on the GeoB3313-1 iron record (Lamy et al.
2001
)] versus solar activity based on
10
Be (green line Steinhilber et al.
2009
) and
14
C(red line Solanki et al.
2004
), for the last
500 years. Grey bars mark the low solar activity periods of the Dalton minimum and the Maunder
minimum. Time series are unsmoothed, detrended and standardized. The negative (positive) iron
anomalies suggest northward (southward) shifted SWW (Lamy et al.
2001
; Varma et al.
2011
).
95 % con
dence intervals (in brackets) for Pearson correlation coef
cients (r) were calculated
using a bootstrap method, where autocorrelation has been taken into account
'
Search WWH ::

Custom Search