Geoscience Reference
In-Depth Information
sediment cores from the tropical West Paci
c showing that the change in Mg/Ca
18
O
foram
signal by
measured in G. ruber leads its
δ
2,000 to
3,000 years
*
*
18
O
foram
and Mg/Ca values measured in foraminifera re
(Fig.
1
). However,
ect
sea-surface temperature (SST) but both are also controlled by their dependency on
sea-surface salinity (SSS) which was quanti
δ
ed earlier by N
ü
rnberg et al. (
1996
)
and con
rmed recently by Kisak
ü
rek et al. (
2008
). This implies that Mg/Ca re
ect a
18
O signal in planktonic foraminifera is inter-
preted by Visser et al. (
2003
)tore
local/regional signal whereas the
δ
ect global rather than a local signal. Although
SSS variations may also interfere with the
18
O
foram
signal the Visser et al. (
2003
)
hypothesis can be tested by a multi-proxy approach simultaneously using
δ
18
O
foram
,
δ
44/40
Ca records applied to the same foraminiferal species of a sediment
core from the Caribbean. Thereby, Mg/Ca and
Mg/Ca and
δ
18
Oisre
δ
ecting differences in both
44/40
Ca is supposed to be solely temperature-driven,
independent from SSS variations (Gussone et al.
2004
).
SST and SSS whereas
δ
44/40
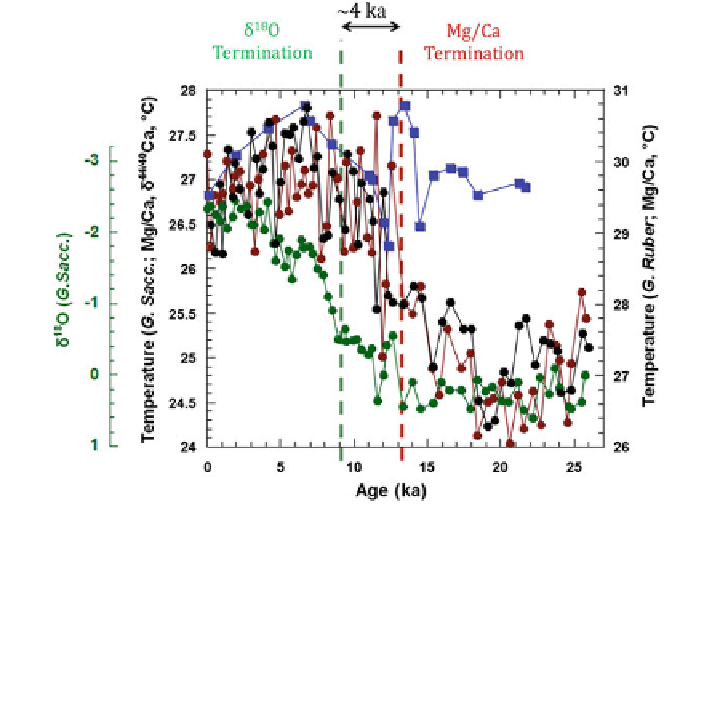
Fig. 1 This
figure shows the Mg/Ca (red G. sacc.; black G. ruber),
δ
Ca (blue G. sacc.), and
18
δ
O records (green G. sacc.) values of two different foraminiferal species G. ruber and G.
sacculifer of core SO164-03-4 as a function of time (ka = 1,000 years); Y Younger Dryas,
A Aller
ø
d, B B
ø
lling. Mg/Ca and
δ
44/40
Ca are in general accord after Termination I (red dotted line
at
*
13 ka BP) but differ to a larger extend during the Glacial. There are clear indications for a
phase shift between Mg/Ca and
δ
18
Oof
*
4 ka between the Mg/Ca Termination and the lagging
18
O Termination (green dotted line at
behind
δ
9 ka BP) as it was reported earlier by Visser et al.
*
18
O values are roughly
(
2003
). Note, that the
δ
2.5
‰
too low when compared to the Mg/Ca
*
record in the critical age range between 13 and 9 ka BP
Search WWH ::

Custom Search