Geoscience Reference
In-Depth Information
(a)
(b)
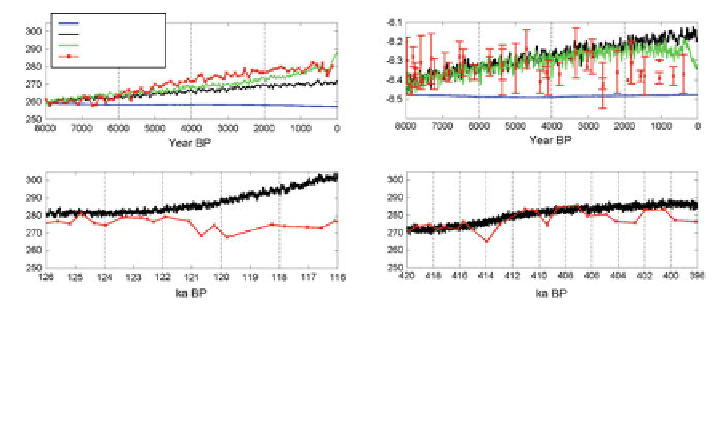
Holocene
orbital only
+ natural forcings
+ anthropogenic
ice core
(c)
(d)
MIS 5.5
MIS 11.3
13
Fig. 1 CO
2
development during interglacials. a Holocene CO
2
, b Holocene
δ
CO
2
, c MIS 5.5
CO
2
, d MIS 11.3 CO
2
. Ice core measurements (red, crosses), orbital forcing only (blue), plus
natural forcings (peat and corals, black), plus anthropogenic landuse emissions (green). Ice core
data as in Elsig et al. (
2009
), Schneider et al. (
2013
) and Petit et al. (
1999
) for Holocene, MIS 5.5,
and MIS 11.3, respectively
process. We conclude that the difference between land and ocean biogeochemical
processes during interglacials can drive atmospheric CO
2
either upward or down-
ward, depending on the strength of warming controlled by orbital forcing and the
history of carbon changes during the preceding terminations.
3.2 Climate and Vegetation Changes
Climate responds to numerous forcings. During interglacials, ice sheet changes are
negligible, leading to a strong in
uence of insolation and greenhouse gas changes on
climate. During the early Holocene,
265 ppm) was
somewhat lower than preindustrial (280 ppm), but summer insolation in the high
northern latitudes was substantially higher. This led to a strong summer warming and
major changes in vegetation, a northerly advance of the northern tree line. Changes in
tree cover for CLIMBER2-LPJ and 8 ka BP are shown in Fig.
2
a. These tree cover
changes compare favourably with reconstructions of woody cover from terrestrial
records as shown in Fig.
2
b. Since we performed transient integrations of the climate
model and used tree cover reconstructions at high temporal resolution, we could show
that the changes in tree cover occurred at similar times in model and reconstructions,
though locally deviations of up to 1,000 years occurred (Kleinen et al.
2011
).
For MIS 11.3 (Kleinen et al.
2014
), we performed transient experiments with
CLIMBER2-LPJ and time slice experiments with CCSM3, which were used to
drive the LPJ DGVM. Climate changes are surprisingly similar for the two models,
though CCSM3 reacts somewhat more strongly to insolation changes. Model
results show large variations for MIS 11.3 climate, with European summer
the CO
2
concentration (
*
Search WWH ::

Custom Search